


.avif)

.avif)
.avif)


Get a guide to creating pitch decks presentation


.png)

It gets harder and harder to impress your potential investors with a pitch deck these days. They see hundreds, if not more, of those yearly. The fact that only 1% of pitch decks can seal the deal makes the odds even grimmer. So, what can make your pitch deck stand out and score an investment? The answer is quite basic –pitch deck components.
A well-thought-out pitch deck is a blueprint that you should use to present your business to the potential investor pool. The primary aim of the pitch deck is to reflect your vision, unique value, goal, and strategy. Metrics play a critical part in this visualization journey.
The metrics you include offer quantifiable evidence of anything you want to bring to the light. It may be your outstanding performance, growth potential, or market traction – the sky is the limit. Carefully chosen metrics will inspire strategic decisions and reassure the investors of your potential.
So, where do you start on this pitch deck metrics journey? Let's discover the path to success together, shall we?
Warren Buffer, the chairman and CEO of Berkshire Hathaway, once said:
"In the business world, the rearview mirror is always clearer than the windshield,"
Implying the use of available data in predicting the future success of your project.
Let's take two practical examples of a pitch deck with and without metrics to compare their effect on the investor:
A startup's pitch deck consists of different slides packed with up-to-date data:
As the presentation unfolds, an investor sees a clear path to success. The measurable odds of the venture intrigue and convince the viewers of a data-backed strategy aimed at bringing revenue.
A business idea is presented without concrete numbers and data to support future gains. The investors start to feel skeptical, wondering about growth figures, conversion rates, and other vital stats. The lack of hard-proof metrics leaves the audience uncertain of the feasibility and scalability of such a business venture.
As you can see from the two examples above, metrics are concrete proof that your business idea is valid. Correct numbers, percentages, and analytical data showcase your business strategy, potential, and performance. When you back up your claims with well-researched figures of customer acquisition cost(CAC), customer lifetime value(CLV), churn rate, etc., you offer a clear picture of the future of your startup. Such an approach goes beyond mere storytelling and empty promises. Thus, it spikes confidence and trust in the investors.
According to the Harvard Business Report, two-thirds of startups fail to secure funding. So, solid and data-driven components of a pitch deck are vital to emphasize your business idea's credibility, authenticity, and scale.
Quantifiable data ensures that abstract concepts become more palpable in the eyes of the potential investor. As you make your story more convincing, you will hold the audience's attention long enough to make a desirable decision.
IMPORTANT!
75% of potential investors may get distracted in the first 10 minutes if the pitch deck doesn't grab their interest.
There are four types of critical metrics that reliable pitch deck consulting services advise to include in your success-driven pitch deck:
Let's have a closer look at each of them.
Almost 60% of presentations lack up-to-date financial data, which has become a downfall of many promising startups. What are the most critical metrics of a pitch deck financial slide to focus on?
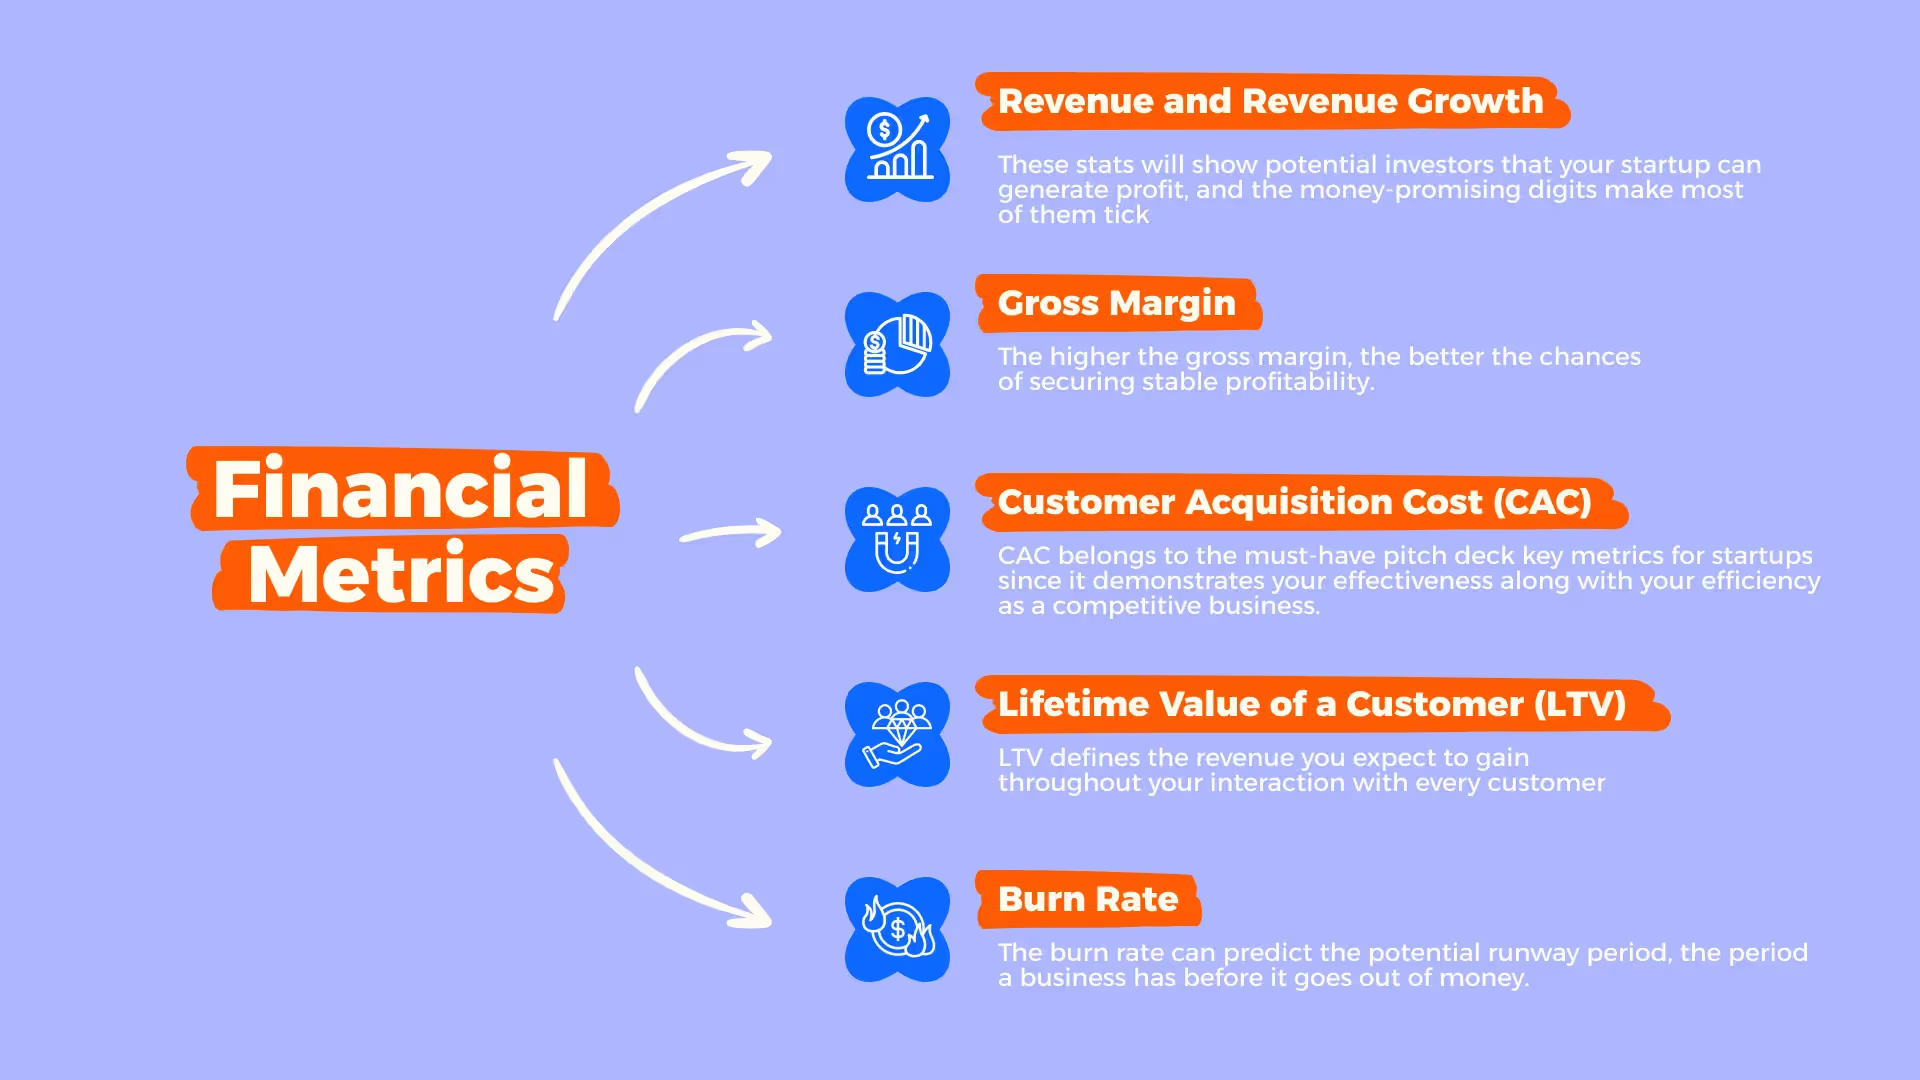
Company revenue is the income you plan to generate from the sales. In turn, revenue growth indicates the rate at which your business's income increases over time. These stats will show potential investors that your startup can generate profit, and the money-promising digits make most of them tick.
EXAMPLE
You run a software company and show your revenue growth from $1 million in the first year to $5 million in the second. The data-based growth trajectory will convince a potential investor of your thriving potential.
Not all the money you make remains in your pocket since there are business-running expenses that the income goes to. A business's gross margin is what's left of your revenue after you minus all the expenses. The higher the gross margin, the better the chances of securing stable profitability.
EXAMPLE
Let's say your SaaS pitch deck metrics indicate a gross margin of 50%. It means that you have 50 cents left of sheer profit from every dollar of income.
How much does it cost you to convert a paying client? That is the simplest definition of a customer acquisition cost(CAC). Such cost usually includes the cost of the marketing efforts, sales cost, and any other related expenses.
A successful CAC formula is simple – the lower the acquisition cost, the better. CAC belongs to the must-have pitch deck key metrics for startups since it demonstrates your effectiveness along with your efficiency as a competitive business.
EXAMPLE
If your company spends $10K on the marketing and acquires 100 paying clients, the acquisition cost for a customer makes $100, which sounds like a good investment.
A lifetime value of a customer or LTV may sound like an out-of-the-context feature when we discuss pitch deck financial metrics for startups. However, LTV defines the revenue you expect to gain throughout your interaction with every customer. It matters to investors mainly because they can compare the LTV and CAC to determine how profitable your client relationships will be.
EXAMPLE
You run a subscription-based business and predict an LTV of $400 per user. Assuming your CAC is $100 per customer, you get the simple ratio of 4:1. It doesn't take long to figure out that it is a clear indicator of a profitable long-term relationship.
A burn rate is sometimes referred to as a negative cash flow. Basically, it is the sum a company spends on a monthly basis without any profit. The burn rate can predict the potential runway period, the period a business has before it goes out of money.
EXAMPLE
If your company's burn rate is $20K a month, you spend this sum to cover the operational costs without a dime of profit. Assuming you have secured $200K of investment, your runway time makes it 10 months without additional funding and with a prospect of gaining sustainable revenue.
Once you determine how your users behave and interact with your business, you can optimize user experience, improve offers, secure long-term relationships, and spice revenue growth and general business sustainability.
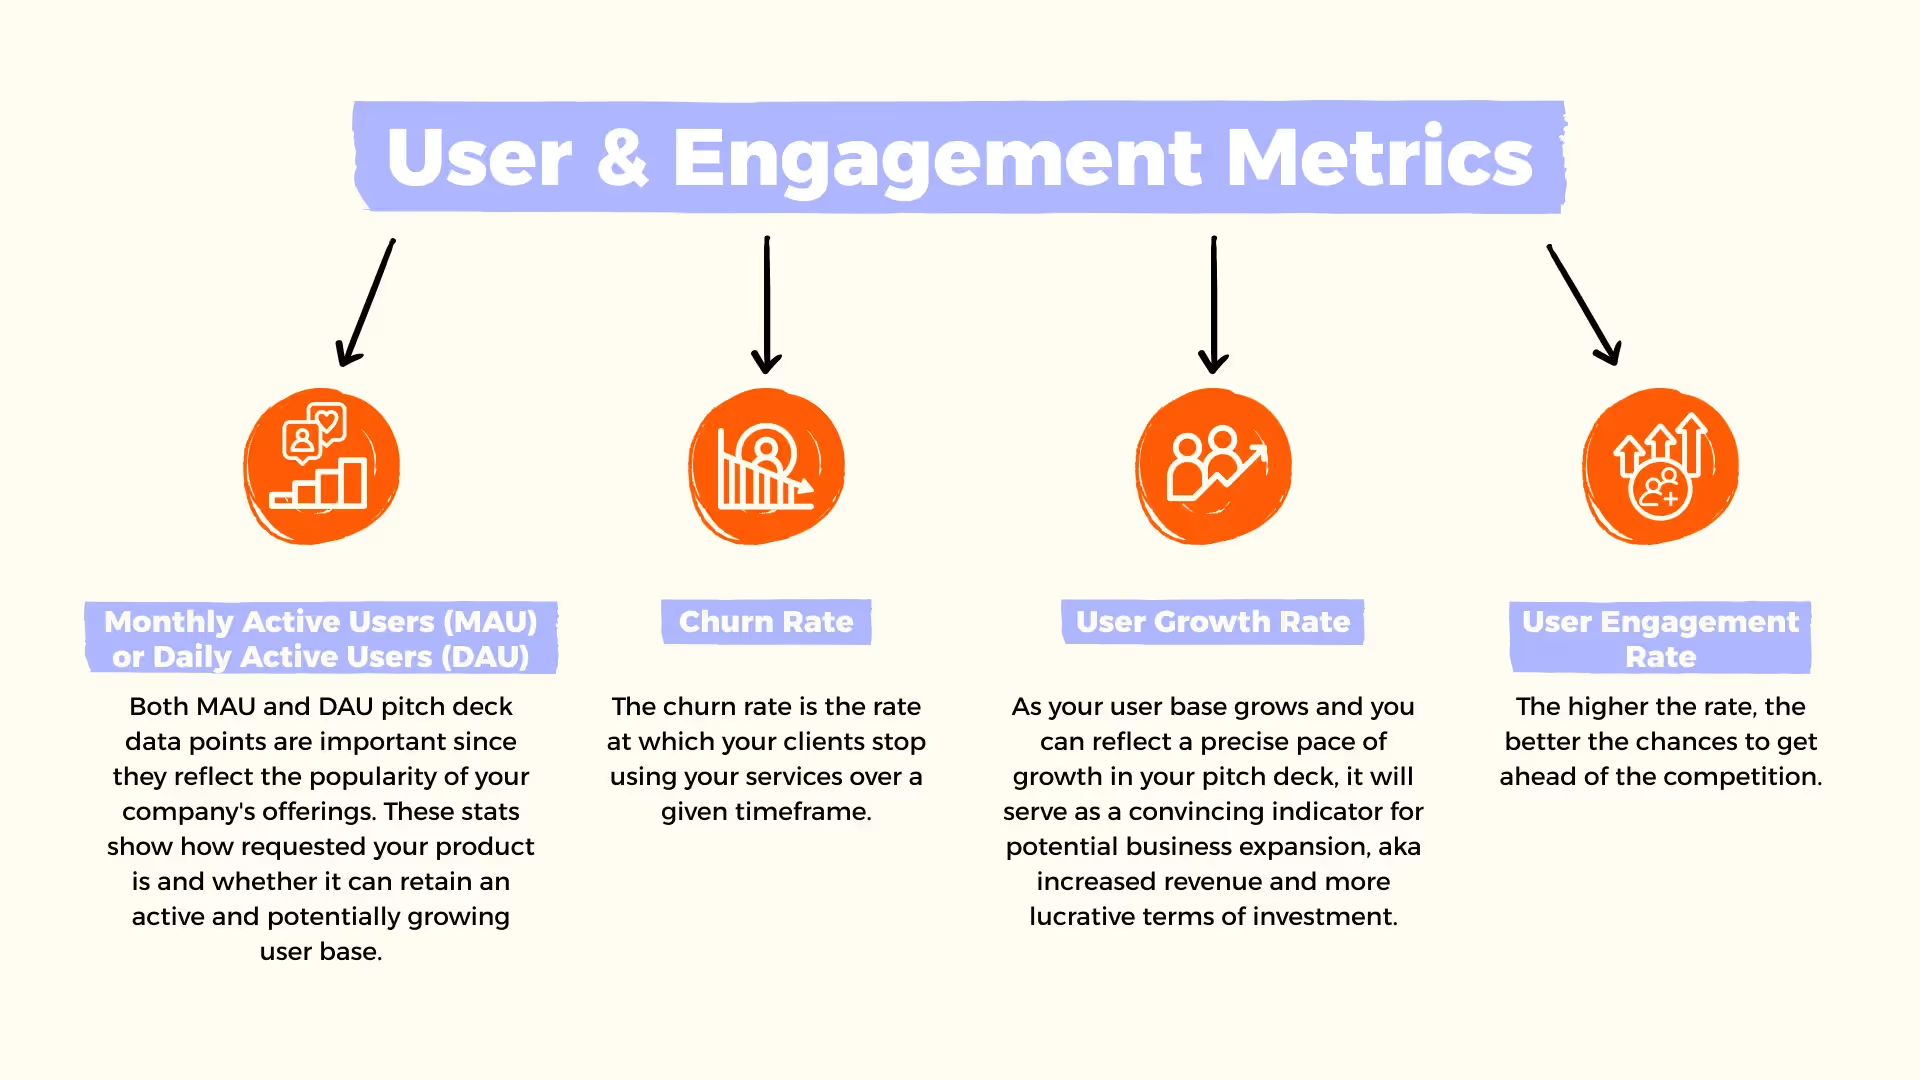
Monthly active users(MAU) and daily active users(DAU) define the number of people who engage with your product over a preset period(day/week/month). Both MAU and DAU pitch deck data points are important since they reflect the popularity of your company's offerings. These stats show how requested your product is and whether it can retain an active and potentially growing user base.
The churn rate is the rate at which your clients stop using your services over a given timeframe. While you may think that the modern market is fast-paced and that some customers naturally part ways with a business at one time or another, a well-calculated churn rate may point to an existing issue. Once you see that people are leaving the platform for no apparent reason, you may want to dig a little deeper and fix potential problems. The lower the churn rate – the easier it is to seal an investment deal.
As your user base grows and you can reflect a precise pace of growth in your pitch deck, it will serve as a convincing indicator for potential business expansion, aka increased revenue and more lucrative terms of investment.
The primary task of the engagement rate stats is to show how relevant, helpful, and popular your offer is among the clients. The higher the rate, the better the chances to get ahead of the competition.
Successful presentation development services know that your company's internal dynamic and efficiency interest your potential investors. Among all the key metrics of a business, product and operational data reflect how your team manages given resources, various processes, and the general effectiveness of the project.
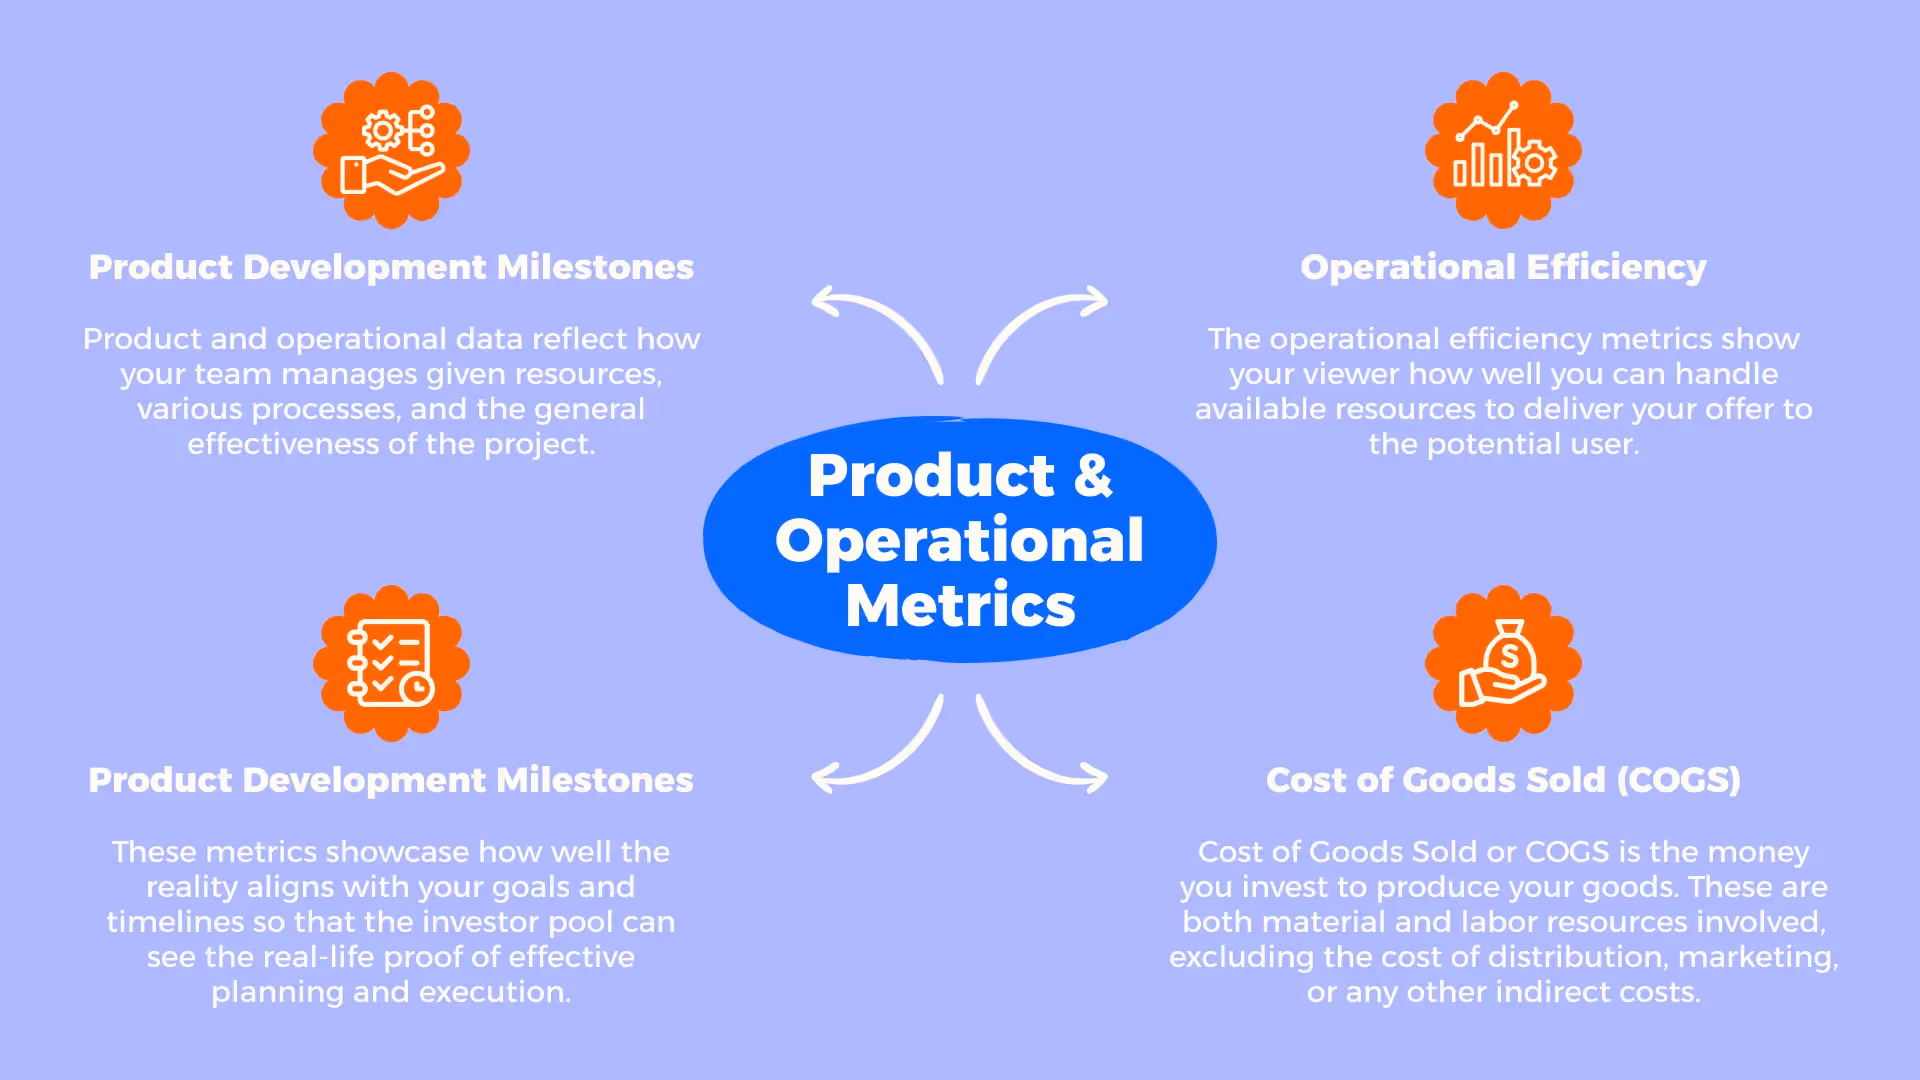
Product development milestones are all about the up-to-date track of every new feature, enhancement range, additional launches, and other elements of the work process. These metrics showcase how well the reality aligns with your goals and timelines so that the investor pool can see the real-life proof of effective planning and execution.
The operational efficiency metrics show your viewer how well you can handle available resources to deliver your offer to the potential user. If the stats are high, the investors will see a well-optimized process, reduced waste, and enhanced productivity. These aspects lead to reduced costs and enhanced output, which makes the investment twice as lucrative.
Cost of Goods Sold or COGS is the money you invest to produce your goods. These are both material and labor resources involved, excluding the cost of distribution, marketing, or any other indirect costs.
The fact that you understand your COGS and know how to manage it is critical for company profitability. Suppose you manage to lower the COGS without decreasing the quality of your offer. In that case, you will present improved margins and a competitive pricing policy, which gets you ahead of the competition.
No matter your business's niche, there is always a bigger landscape to fit in. The more precise your understanding of the market size, potential, and position in the ecosystem, the easier it is to secure the necessary investment.
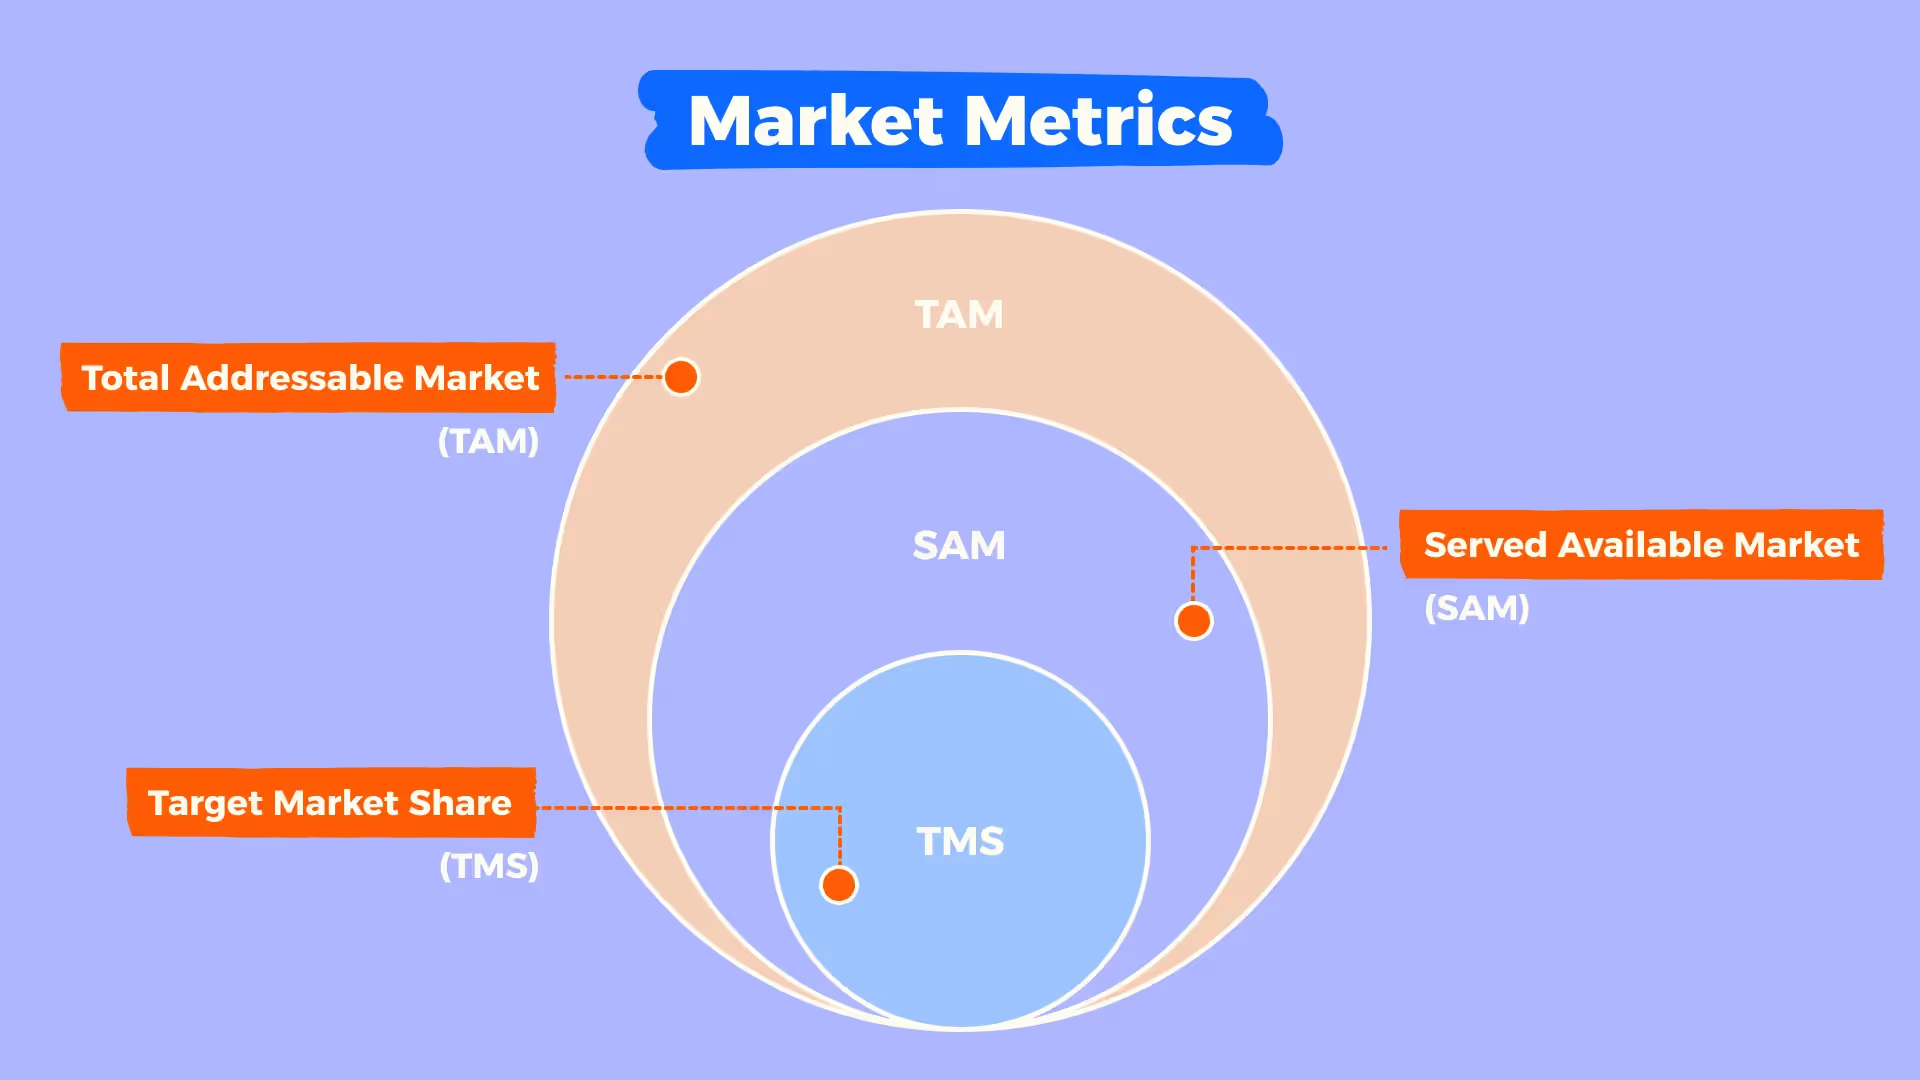
You can calculate the total revenue opportunity within your specific market based on the type of services you offer. That is what Total Addressable Market(TAM) stats are about. Knowing your TAM metrics lets you identify your project's potential, prioritize certain positions, target specific segments, and set realistic growth objectives. All these details help the investors calculate the potential Return On Investment(ROI) and decide whether they want to proceed with the deal.
Served Available Market(SAM) can be referred to as a more localized section of TAM. It is close to impossible to target a global market without competition. Thus, you must minimize your potential target market size to calculate realistic revenue.
Let's discuss a simple example. You are an aspiring SaaS business. Your TAM would identify the global SaaS market. Since you can't be the only company in the world with branches in every country, you will inevitably target a specific user base, and your SAM SaaS startup pitch deck metrics would reflect your potential in the area.
Your target market is basically a group of people who would be interested in acquiring similar services or products that you offer. The Target Market Share is the exact percentage of the market you plan to conquer and convert. Once you have a clear share, you can proceed with plans and strategies for achieving, maintaining, and potentially expanding the share.
Not all the investors are the same. Valid pitch deck presentation examples make us realize that each investor has their own needs and preferences. The better you understand your potential investor persona, the easier it will be to tailor your pitch deck key metrics for investors and secure the required funding.
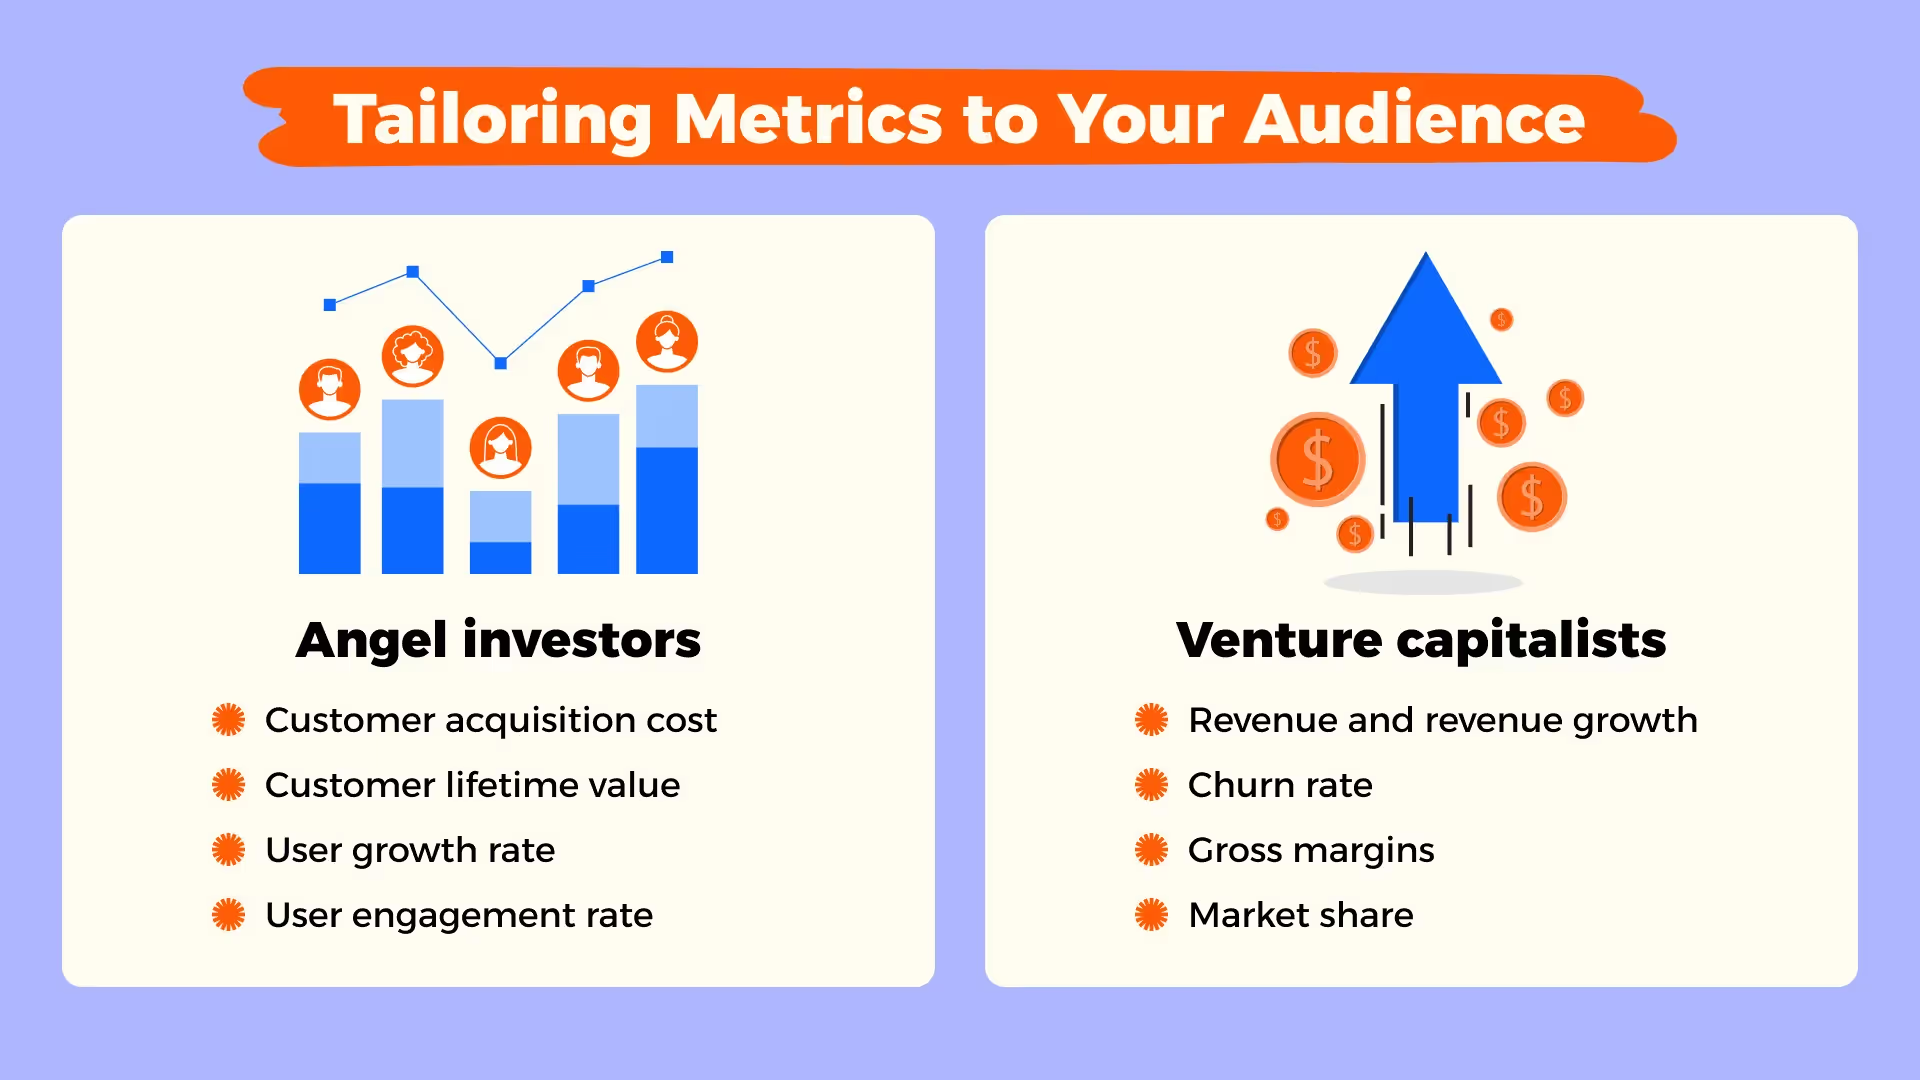
Let's, hypothetically, divide the investors into angel investors and venture capitalists(VCs).
These are individual investors who use their own money to fund a startup. They may be personally acquainted with the person who runs the company or may prioritize the team's expertise or product's uniqueness to be willing to invest.
Since angel investors are all about the compelling story and promising concept, they will be curious about such metrics as:
These are usually larger funds willing to invest their money into projects that can promise substantial returns. They would focus on such stats as:
Every funding stage is unique and requires a different approach and skillful customization to generate the best outcome. Let's look closely at what investors may be curious about during the seed stage and Series A and B.
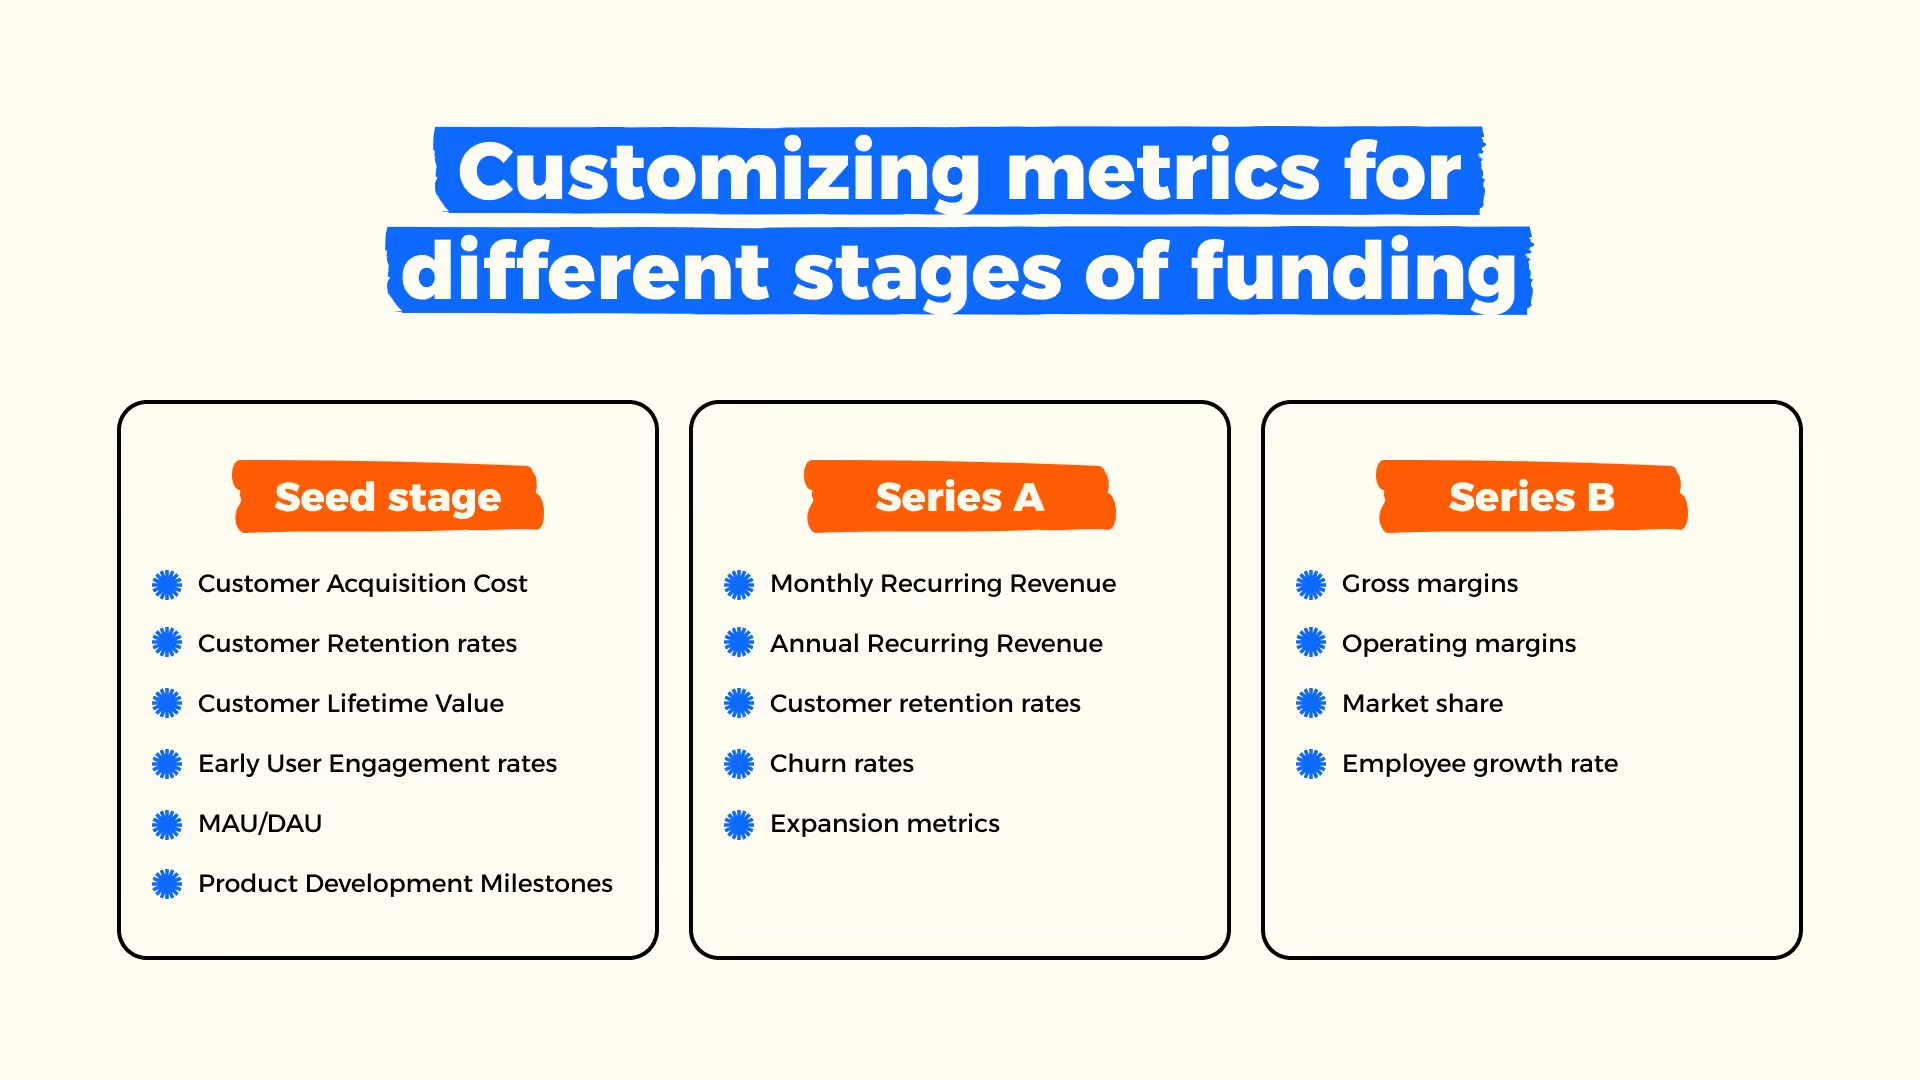
The investors are concerned about the potential of the presented idea. They may care about the following stats:
At this stage, investors are all about revenue growth and sustainability. Thus, they will be interested in the following:
As your business thrives, investors would want to consider expanding, and they would be curious about the following metrics:
Industry-specific metrics can provide potential investors with critical insights into how you plan to satisfy user needs in a specific segment.
In tech, investors care about MAU, Churn rate, and User Engagement rates due to rapid industry growth and unparalleled scalability.
Investors would want to learn more about the patient acquisition cost, clinical trial success rates, and regulatory milestones because of heavy regulations and unique challenges.
E-comm investors are usually concerned about conversion rates, average order value, and related stats since customer behavior is of the essence here.
After you have gathered all the desired metrics, it matters how you present them to the audience. Your presentation must not only be filled with critical data. It should be easy to understand, compelling, and convincing for the investors to want to fund you.
The key components of a pitch deck mustn't overwhelm the audience. Thus, you should pick the most relevant stats to present to the viewers. It is best to stick to a clean and uncluttered layout. The same concerns formatting. All the fonts, colors, and additional details should be consistent.
Charts and graphs are perfect to draw investors' attention to key metrics. You can use pie or line charts to better visualize trends, comparisons, and competition. Some experts use color coding to secure the desired goals. For instance, red tones define negative metrics, while green ones define positive stats.
An overly optimistic or overly realistic presentation will stir doubt in potential investors, so finding the perfect balance between the two is critical. You can oppose challenges with likely progress, stress the areas to improve, and visualize your current achievements.
Crafting a successful pitch deck is a responsible and tricky task. There are many pitfalls to stay clear of. Let's discuss the most common mistakes and how to avoid them effectively.
Heavy statistical data loads may confuse and distract the viewers from the central message of your presentation.
Pro tip
Focus on key elements of a pitch deck with the most relevant metrics displayed. Tailor your presentation according to the audience.
Outdated metrics will make the investors think of your incompetence and doubtful credibility of the presented venture.
Pro tip
Monitor any changes in the field you are about to discuss in the presentation. You can use automated data collection tools to simplify the process. Besides, you shouldn't forget about providing a timestamp to emphasize the creditability of your statistical research.
Any metrics used without context or benchmarks will leave room for doubt concerning the significance or performance of the shared numbers.
Pro tip
Use a brief explanation for every stat added to the presentation. Use comparisons and make the presented metrics tell a story rather than being shared separately.
Present-day investors make critical decisions based on the data presented in your pitch deck. The most relevant and impactful metrics highlight your business strategy, goals, and potential. Depending on your audience – angel investors, VCs, or other funding sources, well-chosen metrics will help you stress that you understand their concerns and priorities and map your mutual road to success.
Yet, you should always remember that a successful presentation isn't a constant. You should refine your pitch deck based on modern trends, market shifts, and circumstances. Your pitch deck is a dynamic tool that changes as your business journey progresses. Spice it up with the right metrics on time, and you will secure any investment you aim for!


867 BOYLSTON ST
BOSTON, MA 02116


