


.avif)

.avif)
.avif)


Get a guide to creating pitch decks presentation


.png)

A financial slide is one of the most critical parts of any pitch deck structure. Investors want to see how your business makes money, what your growth potential looks like, and whether the numbers are realistic.
In this guide, you’ll learn what a perfect financial slide should include, how to structure the numbers, and best practices to make your data clear and convincing.
A financial slide in a pitch deck is where a startup presents its key numbers — revenue, expenses, growth, and future projections. Investors often spend more time on this slide than on any other, because it shows whether the business is financially viable and worth backing. The numbers here should be realistic, clear, and persuasive. In most financial projections pitch deck examples, this slide serves two major purposes:
Showcasing how well your business has done in the past and what you expect in the future proves that you can meet your commitments.
Your startup’s financial landscape allows investors to easily get an idea of cost structures, revenue streams, and the overall profitability of your company.
Investors expect the financials slide to do more than showcase numbers — it should tell a clear story of growth, stability, and opportunity. The goal is to convince them that your projections are grounded in reality and that your funding request is backed by a credible plan.
In a well-prepared financial projections slide pitch deck, the following elements are usually included:
Key assumptions behind projections.Make clear what drives your numbers — market growth, customer acquisition costs, pricing, so investors can understand whether they are realistic.
To win investors and have them make a decision in your favor, you don’t want to pile up as much data as possible. You want a neatly structured slide.Whitepage experts have researched the best pitch deck examples to discover the list of must-have elements. They are the following:
Let’s take a look at each of those.
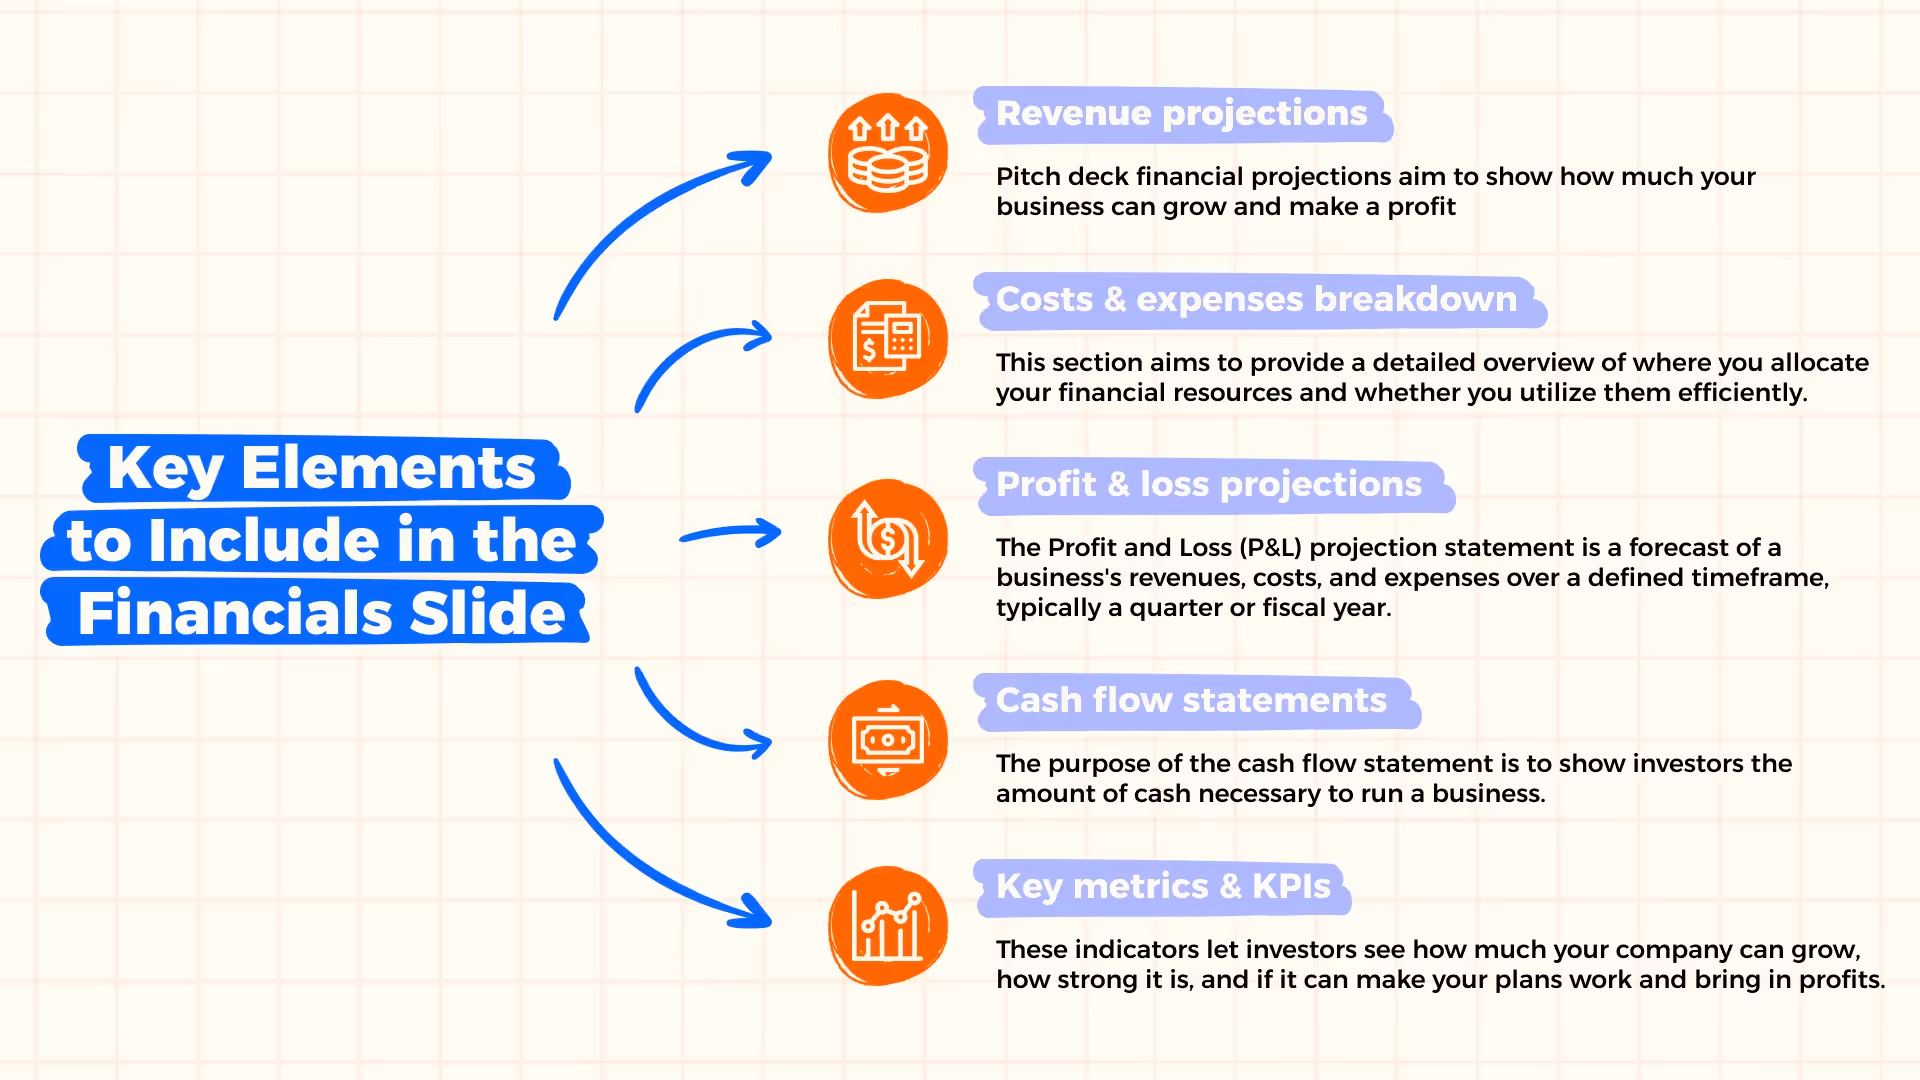
Whatever investor round you’re in – a Pre-seed or a Series C, a financial projections slide is a must. It’s about rough estimates of anticipated income and expenses within a specified timeframe. Pitch deck financial projections aim to show how much your business can grow and make a profit. A well-structured financial projection slide pitch deck highlights not just the revenue potential, but also expenses, cash flow, and profitability timeline, giving investors a clear view of your company’s financial future.
If your business is already doing well, use that info in your pitch deck financial projection slide. If not, you can use research on the market, how your niche is growing, and what your competitors are up to, to guess how your business might do.
With no doubt, you won’t be able to offer a precise forecast but you should try to be as realistic as possible.
“...a fatal move is to over-promise. Some entrepreneurs think they can pull the wool over investors’ eyes and make their projections too good to be true. Do not do this.”
Alejandro Cremades, startup consultant and investor
By clearly portraying your growth and fiscal responsibility within the next 3 to 5 years, you’ll be able to establish credibility and ensure transparency. The specified timeframe is an optimal choice – it helps you plan for the future and takes into account any mistakes that might happen when you're trying to predict things in the long run.
This section aims to provide a detailed overview of where you allocate your financial resources and whether you utilize them efficiently.
Before we cover the breakdown of possible costs and expenses, let's quickly go over the two main types of costs that businesses have to deal with. These are fixed costs and variable costs.
Fixed costs are the same no matter how much a business makes. They stay pretty steady. Variable costs, on the other hand, go up and down. They change based on how much stuff a business is making. If the business makes more stuff, the variable costs go up.
Let’s take a look at the cost breakdown using a hypothetical business as an example. Their expenses may look as follows:
The Profit and Loss (P&L) projection statement is a forecast of a business's revenues, costs, and expenses over a defined timeframe, typically a quarter or fiscal year. It offers insights into a startup’s capability to generate profits through cost reduction, revenue growth, or a combination of both strategies. It should be mentioned that inventors aren’t looking for immediate profitability. Instead, they are focusing on the overall revenue potential.
The P&L statement includes the following key elements:
A cash flow statement shows how money enters and leaves a business. It helps investors understand whether a company generates enough cash to cover daily operations, invest in growth, and manage financing needs. This statement is typically divided into three categories: operating, investing, and financing activities.
Cash generated or spent in day-to-day business operations.
Cash related to acquiring or selling long-term assets or investments.
Cash from raising capital or paying back investors and lenders.
A cash flow statement tells us if a startup can make money and handle upcoming bills. It's all about business profitability and liquidity. Profitability means making a profit and liquidity means having enough ready cash (or things that can be quickly turned into cash) to deal with unexpected costs without messing up the business.
Apart from cash flows, every business has its own special signs of how well it’s doing. These are called KPIs (Key Performance Indicators), and they help measure if the business is healthy and successful. For investors, KPIs are often the lens through which they evaluate startup pitch financials, because these numbers show not just performance today but also the potential for growth and profitability.
Some common business KPIs include:
Keep the number of metrics to a minimum and focus on the critical ones that are specific to your industry.
“When we speak to founders to learn more about their companies, we ask them for these KPIs along with their narrative and other information. It is a quick way for us to understand the current state of the business and we have serious concerns about founders who do not know their KPIs.”
Phil Nadel, Founder and Managing Director at Forefront Venture Partners
Design can break or make the first impression. A good-looking presentation not only makes the info easier to understand but also shows off your company's professionalism in every little aspect.
Below, you’ll find some tried and tested best practices for creating the right visual narrative.
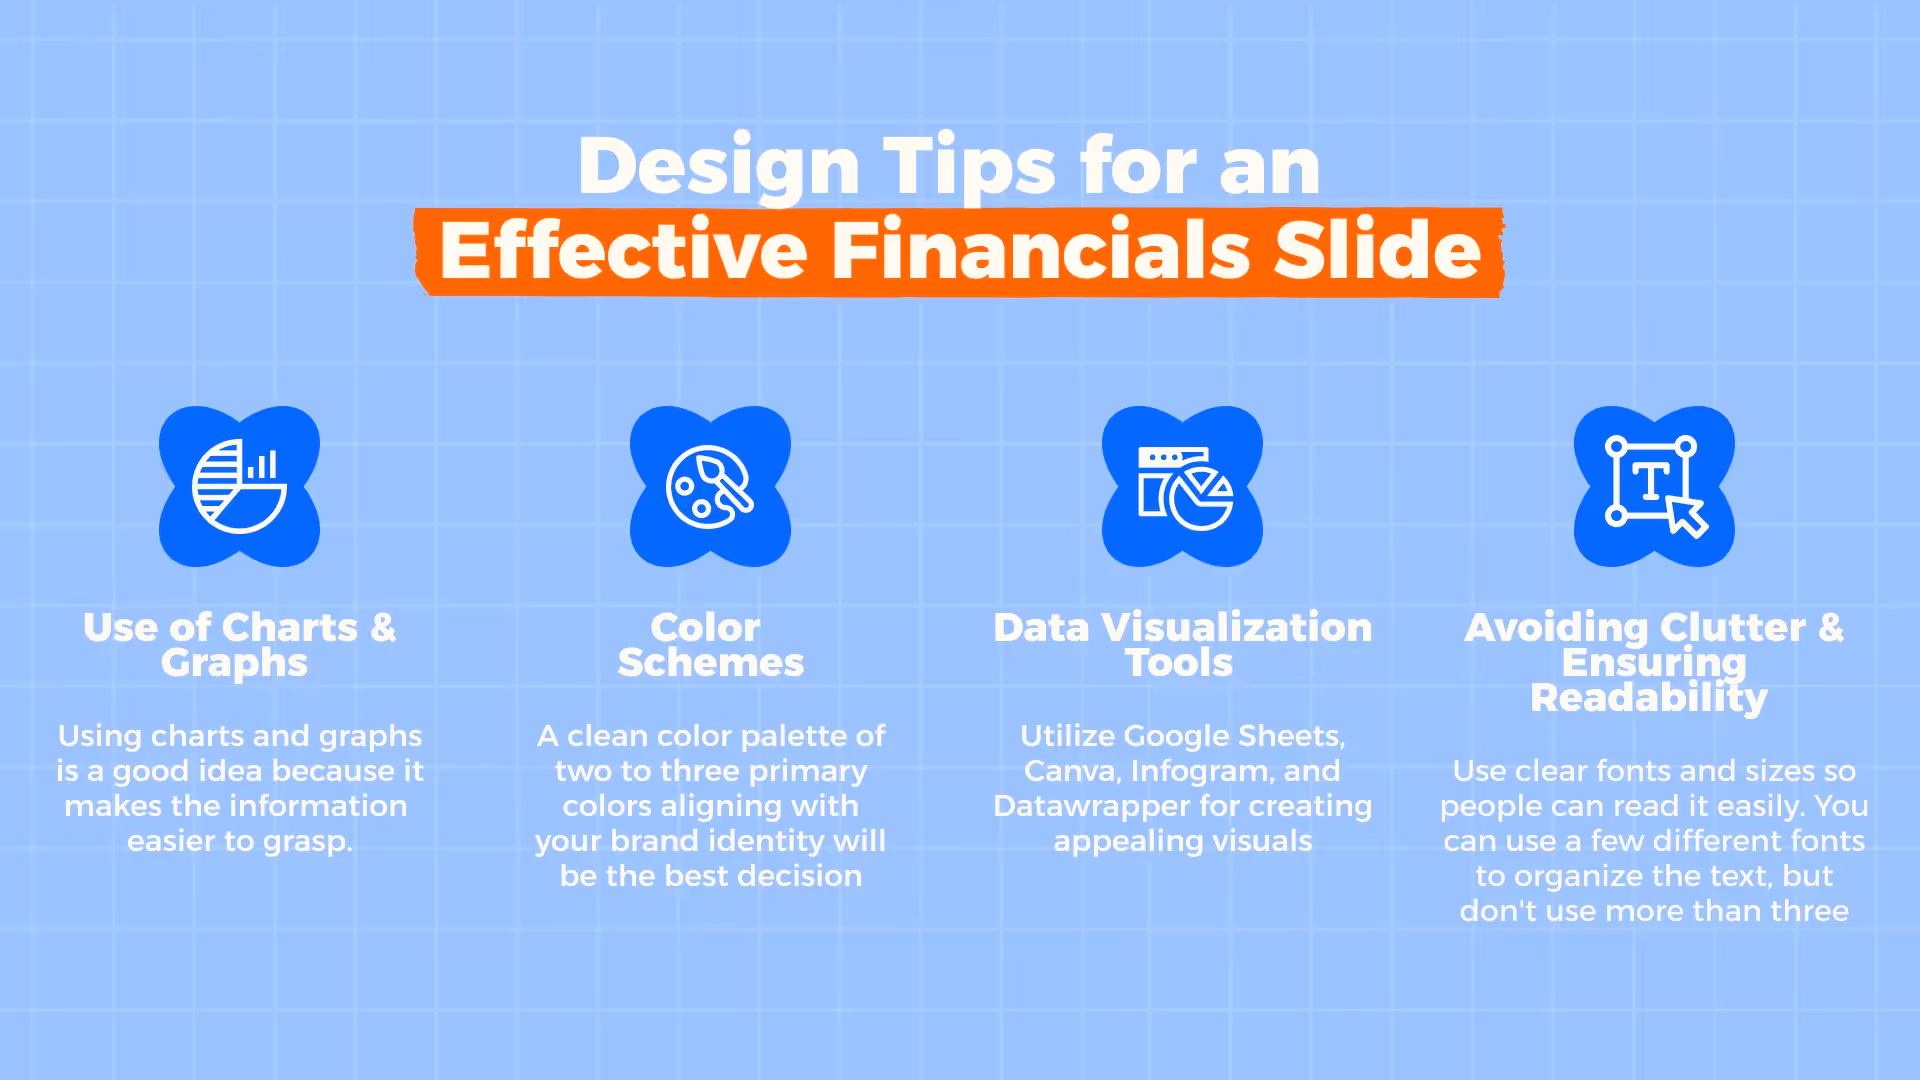
If you have a ton of info in a spreadsheet, it might be too much for investors to quickly understand. Using charts and graphs is a good idea because it makes the information easier to grasp.
Here are the most commonly used data visualization types:
There are multiple tools and software solutions for creating appealing visuals. Here are a few options for you:
This is one of the simplest options. Google Sheets offers a range of options including pie charts, line graphs, and bar graphs. The integration with other Google services makes it a great choice for collaborative real-time editing.
Canva is a design platform that’s not limited to traditional spreadsheets. It offers multiple pitch deck financials templates and comes with versatile customization options. For startups working on their investor decks, it can also serve as a quick financial pitch deck template, helping teams design polished slides without advanced design skills.
Similar to Canva, Infogram allows for streamlining the process of data visualization. This web-based tool is known for its dynamic features to create interactive visuals to enhance audience engagement.
Datawrapper focuses on simplicity. It’s the best choice for presenting complex financial data in an easy-to-understand manner. Being a web-based tool, it enables easy sharing and embedding of visuals.
When presenting financial data, clarity is paramount. Arrange your financial slide neatly and don't put too much writing on it. Use clear fonts and sizes so people can read it easily. You can use a few different fonts to organize the text, but don't use more than three.
As to the font size, stick to Guy Kawasaki’s 10/20/30 rule. The 30 in the rule refers exactly to the font size for any type of presentation. Your headings and labels should be even larger.
The financials slide in a pitch deck is all about making things simple. That's why it's best to use a sans serif font – it helps keep things easy to read and understand.

We’ve just provided the list of Do’s, and now we move to the list of Don’ts. Avoid these common mistakes to make your pitch deck fundraising slides stand out and captivate:
Focus on key metrics and don’t overcrowd your slide with excessive data to ensure clarity and impact.

2. Using confusing or misleading visuals
Use pictures and charts to help people understand, not to make things confusing. Pick visuals that are accurate and easy to get so they can back up your financial story.
3. Not aligning financials with the overall business narrative
Ensure your financials connect with the overall business storyline and provide investors with a clear and smooth story of your company’s past, present, and future.
A strong financial slide doesn’t just list numbers — it translates projections into a compelling story about growth, profitability, and scalability. For investors, clarity and structure matter as much as ambition. Below are three examples of financial slides from real startup pitch decks that illustrate how different companies approach this challenge.
1. Airbnb — Early Financial Projections

This slide from Airbnb’s original pitch deck shows a simple yet powerful forecast: $500K sought in the Angel Round, projected transactions (80K), and an expected $2M in revenue. The design is minimalist but effective, connecting investment directly to growth outcomes.
2. Front — Capital Efficiency Slide

This slide from Front’s pitch deck demonstrates how the company managed capital efficiency and highlighted its financial discipline. It shows $1.3M spent in 18 months to reach $1.4M ARR, with $1.8M left from the last seed round, a $90K monthly burn rate, and a clear path to profitability within 5 months. The slide is direct and transparent, giving investors confidence that the company can scale sustainably without excessive spending.
3. LinkedIn — Financial Performance & Scaling Path

LinkedIn’s deck highlights capital efficiency with clear KPIs: money spent, ARR achieved, burn rate, and a timeline to profitability. The slide also includes a multi-year projection table (2003–2007) with users, revenue, expenses, and operating margin. This level of transparency helped investors see the company’s scaling path.
The financials pitch deck slide is super important for winning over investors. It's not just about showing numbers; it's like telling a story about your financial situation and future plans. Spend some extra time making this slide look good and sharing all the details. That way, you can make investors feel confident and trust you. The effort you put into your pitch deck financial slide can turn into actual investments to help your business grow.
Need expert help?Whitepage's professional presentation design services will help you ace your pitch deck in no time!


Usually, investors expect to see the core numbers that reflect your business performance and growth potential. A strong financial slide pitch deck should highlight revenue history, expense breakdown, cash flow, and profitability metrics (e.g., gross margin, EBITDA). It also needs to include financial projections for the next 3–5 years. Adding your funding needs and runway makes it clear how much capital is required and what milestones you plan to achieve with it.
Your pitch deck financial projections don’t need to cover every line item, but they should be specific enough to demonstrate credibility. Typically, founders present high-level forecasts of revenue, expenses, and cash flow over 3–5 years. Investors want to see realistic growth, not overly optimistic assumptions. A clear financial slide in pitch deck works best when it highlights the key drivers behind projections such as customer acquisition, pricing model, or market growth, because this adds both trust and clarity.
The financial projection slide in a pitch deck should be clear, visual, and easy to digest. Use simple charts or tables to highlight revenue growth, profitability timeline, and cash runway. Focus on trends and milestones, not overwhelming detail. Many startups include a year-by-year breakdown with major assumptions called out, so investors quickly understand how the business is expected to scale.
Creativity in financial slides is not about flashy design but about making complex numbers easy to understand. The most effective way is to use visuals: line charts, milestone-based graphs, or simple comparisons. That shows trends clearly. A strong startup pitch deck financials slide turns projections into a story investors can follow with confidence.


867 BOYLSTON ST
BOSTON, MA 02116


