


.avif)

.avif)
.avif)


Get a guide to creating pitch decks presentation


.png)

Your financial projections slide gets more investor attention than almost anything else in your deck. Here's what this post covers:
When an investor opens your pitch deck and lands on the financial projections slide, they're not asking: "Will this revenue actually happen?" They already know it won't — not exactly, not at an early stage. What they're asking is: "Does this founder understand their own business well enough to model it?"
Tim Berry, founder of LivePlan, puts it directly: "Investors look at startup forecasts for concepts, not accuracy." The Angel Capital Association echoes the same point — at the earliest stages, investors don't expect validated forecasts, because early-stage companies rarely have the operating history to back their own assumptions. That's understood on both sides of the table.
What isn't forgiven is showing up without projections at all. A founder who once walked into an investor meeting and announced that "everybody knows financial forecasts are just BS, so we don't have one" lost every person in that room on the spot (LivePlan). Not because his numbers were wrong. Because the absence of them said something far worse: that he hadn't thought it through.
Your projections are a proxy for your judgment. A slide that grows at a perfectly smooth 15% month-over-month for 36 straight months tells an investor you used a formula. One that spikes in Q3 because you're adding three salespeople, dips in Q1 due to a seasonal pattern you've actually observed, and reaches break-even in Month 22 based on a specific cost assumption — that tells them you understand how your business runs. That's the standard. Not accuracy. Defensibility.
Financial projections in a pitch deck are forward-looking estimates of your company's revenue, costs, and path to profitability — typically presented as a single slide near the end of the deck, after business model and market opportunity.
The purpose is not to forecast the future with precision. It's to demonstrate that you understand the financial mechanics of your business well enough to model them. A well-constructed projections slide shows the relationship between your growth drivers (hiring plan, conversion rates, pricing, churn) and your financial outcomes. When those relationships are visible and coherent, the slide works. When the numbers appear without context, investors fill in the gaps themselves — and rarely in your favor.
The standard financial projections slide in a pitch deck answers three questions: What does your revenue trajectory look like over 3–5 years? What are the assumptions behind those numbers? And when does the business reach profitability — or at least capital efficiency?
For early-stage startups, the slide typically includes:
What this means for your deck: the projections slide needs to match the rest of your story. For a deeper look at how the financial slide fits within the overall pitch narrative, our guide on how to structure a presentation walks through the full arc — including why financials work best as the payoff to the story, not the opening.
What the slide is not is a full income statement reformatted as a PowerPoint table. That belongs in your data room. The deck slide is a summary — designed to show confidence and logic, not to replace the model.
One thing worth calling out separately: if your team slide shows four people and your financial model assumes $5M in Year 1 revenue, something doesn't add up. Investors read decks as a whole. Inconsistencies between team, go-to-market, and financial slides raise more questions than the projections themselves — and they always get raised in Q&A.
"Financial slides are where optimism meets scrutiny. They're where teams soften claims, add sources, lower projections, and refine language to avoid overstatement."
The most reliable approach starts from your unit economics, not from a revenue target. Working backward from "we need to show $10M by Year 3" produces projections that sophisticated investors can dismantle in the first follow-up question.
Working forward looks like this:
The result of this process is a set of projections you can actually defend — because every number connects back to a business decision you can explain.
Here's why that matters: investors don't just read the numbers on your slide. They read the logic connecting them. A model built from unit economics gives them something to engage with. A model built backward from a target gives them nothing to trust.
The bar has moved. What passed at Series A three years ago doesn't clear it today.
Series A now typically requires $2M+ ARR, up from the $1M threshold that was standard not long ago. Expected growth rates are 3x year-over-year. For seed-stage companies, the expectation is 100–200% annual growth, with 10–20% month-over-month momentum.
On capital efficiency, burn multiples above 2.5x are increasingly treated as a red flag by Series A investors (Data Driven VC). The target at Series A is around 1.0–1.5x. For SaaS specifically, the LTV:CAC median sits at 3.6:1 (RockingWeb, 2025) — with 3:1 as the generally accepted floor.
What these benchmarks also tell you is where you have room to explain deviations. If your CAC payback is longer than 18 months but your NRR is 130%, that's a story worth telling explicitly — not a number to hide in a footnote.
The key takeaway is this: deviating from a benchmark isn't automatically a red flag. Deviating without an explanation is.
Think of this as a build-and-check guide. The first half covers what a strong projections slide looks like and how to construct it. The second half covers the patterns that undermine credibility — the ones we see most often across 150 client conversations and 1,000+ decks.
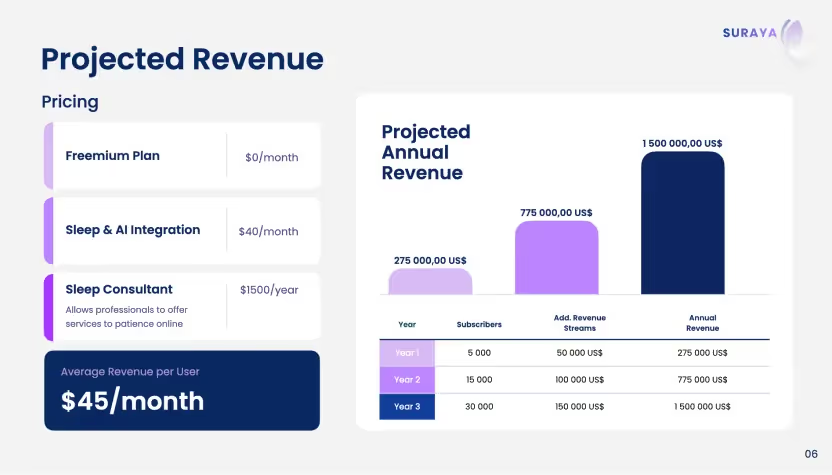
What the slide needs to do: Lead with a chart, not a table. A revenue growth bar chart with clearly labeled years communicates in seconds; a reformatted P&L asks investors to do work they won't do in a 146-second deck review. The detailed model belongs in your data room.
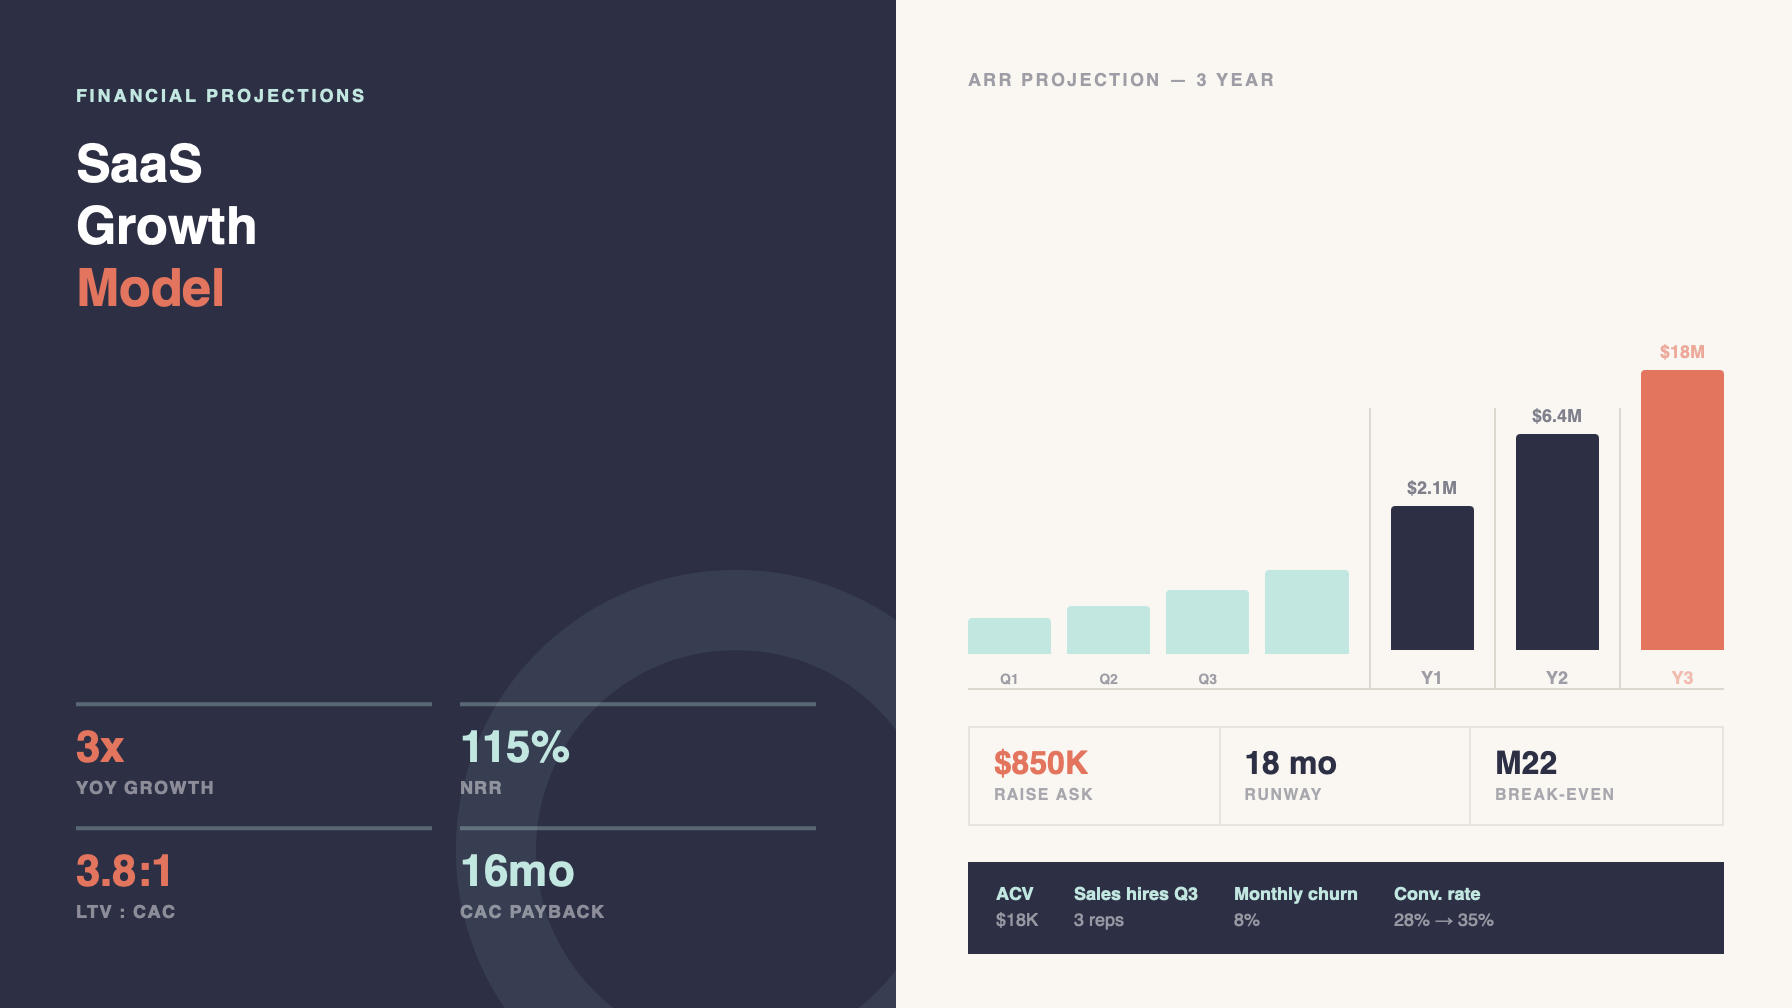
State your assumptions explicitly. Either as a callout box on the slide or in structured speaker notes. Something like: "Based on 3 sales hires in Q3, each closing 5 deals/month at $18K ACV, with 8% monthly churn." That level of specificity — even if the numbers are estimates — signals that you've actually modeled the business rather than illustrated a hope.
Connect the raise to a milestone. "This round gets us to $2M ARR in 18 months, at which point we're positioned for Series A." The link between funding ask, model, and outcome is what investors are scanning for when they read the slide.
Buffer's 2011 seed deck is still one of the clearest examples of this approach working. They raised $500K by showing real numbers — $50K in annual revenue, 55,000 users at the time of the pitch — rather than projected ones. The credibility came from transparency, not from a growth curve. They went on to build a $20M+ ARR business and became a recurring case study in how radical financial openness builds investor trust (Upmetrics).
In practice, this looks like: not "here's how big this could be" — but "here's exactly where we are, here's the logic, and here's where this funding takes us." Those are three different statements. Most slides only make the first one.
Now, the credibility killers — the patterns that come up again and again:
Top-down market share claims without bottom-up support. "We'll capture 5% of a $10 billion market" is a placeholder, not a projection. Every investor has seen it hundreds of times. The fix is a bottom-up model built from your actual customer acquisition logic: how many customers you're adding per month, at what cost, with what conversion rate.
Relying heavily on AI tools. AI tools can populate a financial slide template quickly — but they typically can't build projections grounded in your actual unit economics, market dynamics, or business model slide logic. The result is often a slide with plausible-looking numbers that falls apart under the first investor question. For more on this, see our post on why AI-generated pitch decks fail.
Overoptimistic conversion assumptions. In practice, this is one of the most common things we flag. A subscription conversion rate of 60% in Year 1. A customer acquisition pace that would require a sales team three times the size of the one in the hiring plan. The client's response is almost always: "That feels high — should we start at 30% and ramp?" Yes. Start at what you can defend.
Projecting 70%+ profit margins at an early stage. This signals that a founder hasn't worked through the cost side of the model. Unrealistic margins don't read as ambition — they read as inexperience with the operational reality of building a company.
Ignoring costs entirely. Some decks present only a revenue chart and nothing else. Without costs, investors can't evaluate burn rate, capital efficiency, or the fundamental economics of the business model. It's one of the fastest ways to end up without a follow-up meeting.
Numbers that don't match the rest of the deck. If your team slide shows four people and your financial model assumes $5M in Year 1 revenue, something doesn't add up. Investors read decks as a whole. Inconsistencies between team, go-to-market, and financial slides raise more questions than the projections themselves — and they always get raised in Q&A.
SaaS projections require a different structure because revenue compounds through retention rather than repeated individual transactions. The metrics that matter most — and the level of validation investors expect — shift depending on where you are.
At seed: Investors want directional unit economics. ARR per customer, an early churn read, and a CAC estimate — even if based on a small sample. "We're seeing 120% NRR across our first 50 customers" is more credible than a projected 120% NRR with no evidence attached. The Sequoia pitch guidance is direct on this: "Be transparent. Investors know your projections won't be perfect, but they want to see how you think about growth."
At Series A: These metrics need to be validated. The 2024 SaaS median for CAC payback was 18 months — up 14% from the prior year (Drivetrain). If your payback period is longer, you need a clear explanation tied to deal size or market dynamics, not silence.
A practical SaaS projections slide template for a seed deck includes: a 3-year ARR growth chart (monthly for Year 1), a metrics callout box showing NRR, LTV:CAC, CAC payback, and burn multiple, a funding-to-milestone statement, and 2–3 stated assumptions. That's it. Everything else — cohort analysis, detailed P&L, customer-level breakdown — goes in the model you share after the first meeting.
For the bridge between a working financial model and a slide that actually communicates it, let’s check the examples of financial projections slide for Non-profit and SaaS industries.
Non-profits pitching foundations, impact investors, or government funders face a structurally different challenge. The slide doesn't show revenue and profit — it shows funding sources, program efficiency, and the sustainability of the model beyond the current grant cycle.

What foundation funders typically expect to see:
The underlying communication challenge is identical to a for-profit deck: show that the logic is sound, the assumptions are grounded, and the organization has thought through what happens when conditions change. The metrics are different. The standard is the same.
Financial projections are one of the slides we spend the most time on in every engagement — not because the numbers determine the outcome, but because of what they reveal about how a founder thinks. After 12 years and 4,000+ pitch decks across seed through Series B, we've seen the full range: models that made investors lean in, and slides that quietly ended conversations before they started.
What we do at Whitepage isn't hand you a template and wish you luck. We start with your actual business — your revenue assumptions, your cost structure, your unit economics — and work through the logic with you before a single slide gets designed. That process usually surfaces the things that would have come up in Q&A anyway: an acquisition cost that doesn't account for the full sales cycle, a churn assumption that hasn't been tested against your earliest cohort, a growth trajectory that outpaces the hiring plan sitting three slides earlier in the same deck.
Our financial modeling service covers investor-ready 3–5 year models, unit economics structuring, and the integration between your model and your deck — so the numbers on the slide and the story around them are telling the same thing. For founders who already have a model but need help translating it into a slide that communicates clearly under a 146-second review, we do that too.
The clients we've worked with have gone on to raise collectively over $1.5B. That's not a claim about our projections being accurate — it's a reflection of what happens when the financial logic in a deck is built to hold up, not just to impress.
If you're currently working on your projections and want a second set of eyes on what you have — whether it's a full model, a draft slide, or just a set of assumptions you're not sure how to defend — we're happy to take a look.


At minimum: a 3–5 year revenue projection (with Year 1 broken down monthly), a cost structure showing how expenses scale, a burn rate and runway figure, and 2–3 key assumptions stated explicitly. For fundraising decks, also include a use-of-funds breakdown that ties directly to the projections and shows what milestone the raise enables.
Build forward from your unit economics — average deal size, customer acquisition cost, churn rate, and gross margin. Don't start with a revenue target and work backward. Projections built from defensible business drivers are far easier to explain in Q&A, and far more likely to survive investor scrutiny than those reverse-engineered to look compelling.
As of 2025, the typical Series A bar includes $2M+ ARR (up from $1M in previous cycles), 3x year-over-year growth, an LTV:CAC ratio of 3:1 or higher, and a burn multiple of 1.0–1.5x. CAC payback under 18 months is increasingly expected. These are ranges, not hard requirements — but deviating from them without a clear explanation raises questions. (Sources: PitchBob 2025, Data Driven VC, Benchmarkit)
Top-down projections start with market size and claim a percentage of it: "We'll capture 5% of a $10B market." Bottom-up projections build from operational inputs: "We'll hire 3 salespeople in Q3, each closing 5 deals per month at $18K ACV." Investors strongly prefer bottom-up, because each assumption is testable. Top-down projections are acceptable as a cross-check, but shouldn't be the primary logic.
Three years is the standard for seed and early Series A decks, with Year 1 broken down monthly and Years 2–3 shown annually or quarterly. Beyond three years, projections become increasingly speculative and can actually undermine credibility if they show unrealistically smooth growth. Five-year projections are more common for later-stage raises or when there's a specific strategic reason to show the long-term trajectory.


867 BOYLSTON ST
BOSTON, MA 02116


