


.avif)
.avif)
.avif)


Get a guide to creating pitch decks presentation


.png)

Last Tuesday, a founder pulled up his deck on a discovery call with us. Twenty-eight slides. Four different fonts. A rocket ship clip art on the "next steps" page. "I know it's bad," he said, and then spent ten minutes explaining why investors weren't calling back.
We hear some version of this every week. After 12 years, 4,000+ pitch deck projects, and over $1.7 billion raised by our clients, we've stopped being surprised by the pattern, but we haven't stopped learning from it. The market data doesn't explain everything, but it explains a lot. And when you pair industry-wide statistics with what we see on actual founder calls — the 38-slide decks, the ChatGPT outlines with mismatched projections, the "I know it needs work but I don't know where" conversations – you start to see why some decks open doors and others get two minutes of polite skimming.
We compiled this post with 60+ current statistics about pitch decks, investor behavior, and fundraising outcomes, sourced from DocSend, McKinsey, CB Insights, Harvard Business School, Crunchbase, and others. Between the numbers, we added what we actually see on the ground: patterns from discovery calls, project intake, and the decks that actually worked.

Founders don't lose rounds because capital disappeared. They lose rounds because capital got selective, and their deck didn't keep up.
When three-quarters of all VC capital flows to 30 funds and fundraising cycles stretch to nearly two years, the phrase we hear most often on calls is some version of: "We keep getting stuck at the creatives — just getting the deck to the final mile so we feel like, okay, let's send it out." That stall costs weeks. In this market, weeks cost rounds.
The thing nobody tells first-time founders: the deck isn't the last step before fundraising. It's the first filter. And the longer you treat it as an afterthought, the longer that 12.5-week average timeline stretches.
There's a persistent mismatch between how much founders want to say and how much investors are willing to hear. The data shows 2 minutes 24 seconds. But most decks are built as if the audience has 20 minutes and genuine curiosity about your tech stack.
Across hundreds of founder conversations we saw at Whitepage, the average incoming deck runs about 38 slides.
The data says funded decks average 19–20. The best-performing seed decks use 10–14. That's a 2.5:1 gap. And it's not because founders are clueless, they're thorough. They've spent months on the product and they want to show every angle. One diagnostics founder put it honestly: "Going from 28 slides to 6 with a professional's eye; it's not a trivial pursuit." He's right. Cutting a deck in half while making the story stronger, that's the actual work. Adding slides is easy. Knowing which 12 earn their 21 seconds is hard.
About 40% of pitch deck clients are technical or academic founders – and they consistently make the same mistake. They lead with how their technology works instead of why investors should care. As one founder admitted: "I tend to fall in love with science — but I recognize that is not the audience."
The +40% on Team slides is the most important shift we've seen in recent years. In an AI-saturated landscape, VCs are leaning into the humans behind the product. We now spend more time on team positioning than we did even two years ago – it's no longer a throwaway slide at the end.
The slide engagement data confirms this. Generic TAM bubbles and four-quadrant competitor grids aren't earning their screen time. At Whitepage, we structure every deck so the first three slides do the heavy lifting – problem, opportunity, and a reason to believe – because the data says 70% of the decision happens right there.
I've lost count of how many discovery calls start with some version of: "So, we have this event in one week..."
The funnel math explains a behavior pattern that surprises no one who's been through a raise: procrastination followed by panic. When founding teams realize they need to contact 58+ investors, hold 40 meetings, and wait 12.5 weeks – they suddenly understand that their deck had to be written last month.
In my experience, the deck becomes urgent precisely because it was treated as the last step rather than the first. An advisor to one Series A pitch deck founder put it bluntly: "They flip through a deck and you have single digit minutes." When each of those 58 investors gives you under 2.5 minutes, the deck isn't a document – it's a conversion tool that needs to perform consistently across dozens of cold first impressions.
The warm intro numbers are dramatic – 40x gap, hard to argue with – but honestly, the mobile stat might change more about how you actually build your deck.
If 70% of first views happen on a phone, your 8pt footnotes and five-column comparison tables are invisible on first glance. The investor scans on mobile. If the deck survives that scan, they reopen on the desktop. If it doesn't? No second chance.
Every slide needs to pass what I'd call the phone test: can the core message land on a 6-inch screen without zooming? If you're squinting, the slide needs work. Fewer words, larger type, one idea per view. And this matters double for cold outreach, there's no relationship goodwill to carry you past a cluttered first impression. Even with an 80% warm response rate, the deck is what gets forwarded to partners. It has to work in an empty room.
The #1 pain point founders describe in our discovery calls, roughly 80% of the time, isn't "it doesn't look pretty." It's "it doesn't tell the story." One pre-seed consumer founder put it plainly: "I don't think it helps tell the story. The design is okay. But that's not my specialty."
The root cause is what we call the "us, us, us" pattern – the single most common structure across our 4,000+ projects. Founders and enterprise teams alike build decks that lead with their features, revenue history, and technology stack instead of leading with the audience's pain. A VP at a medical device company showed us his deck and called it out himself: "It's all about us, us, us. I don't think any company particularly cares about our revenue growth per year."
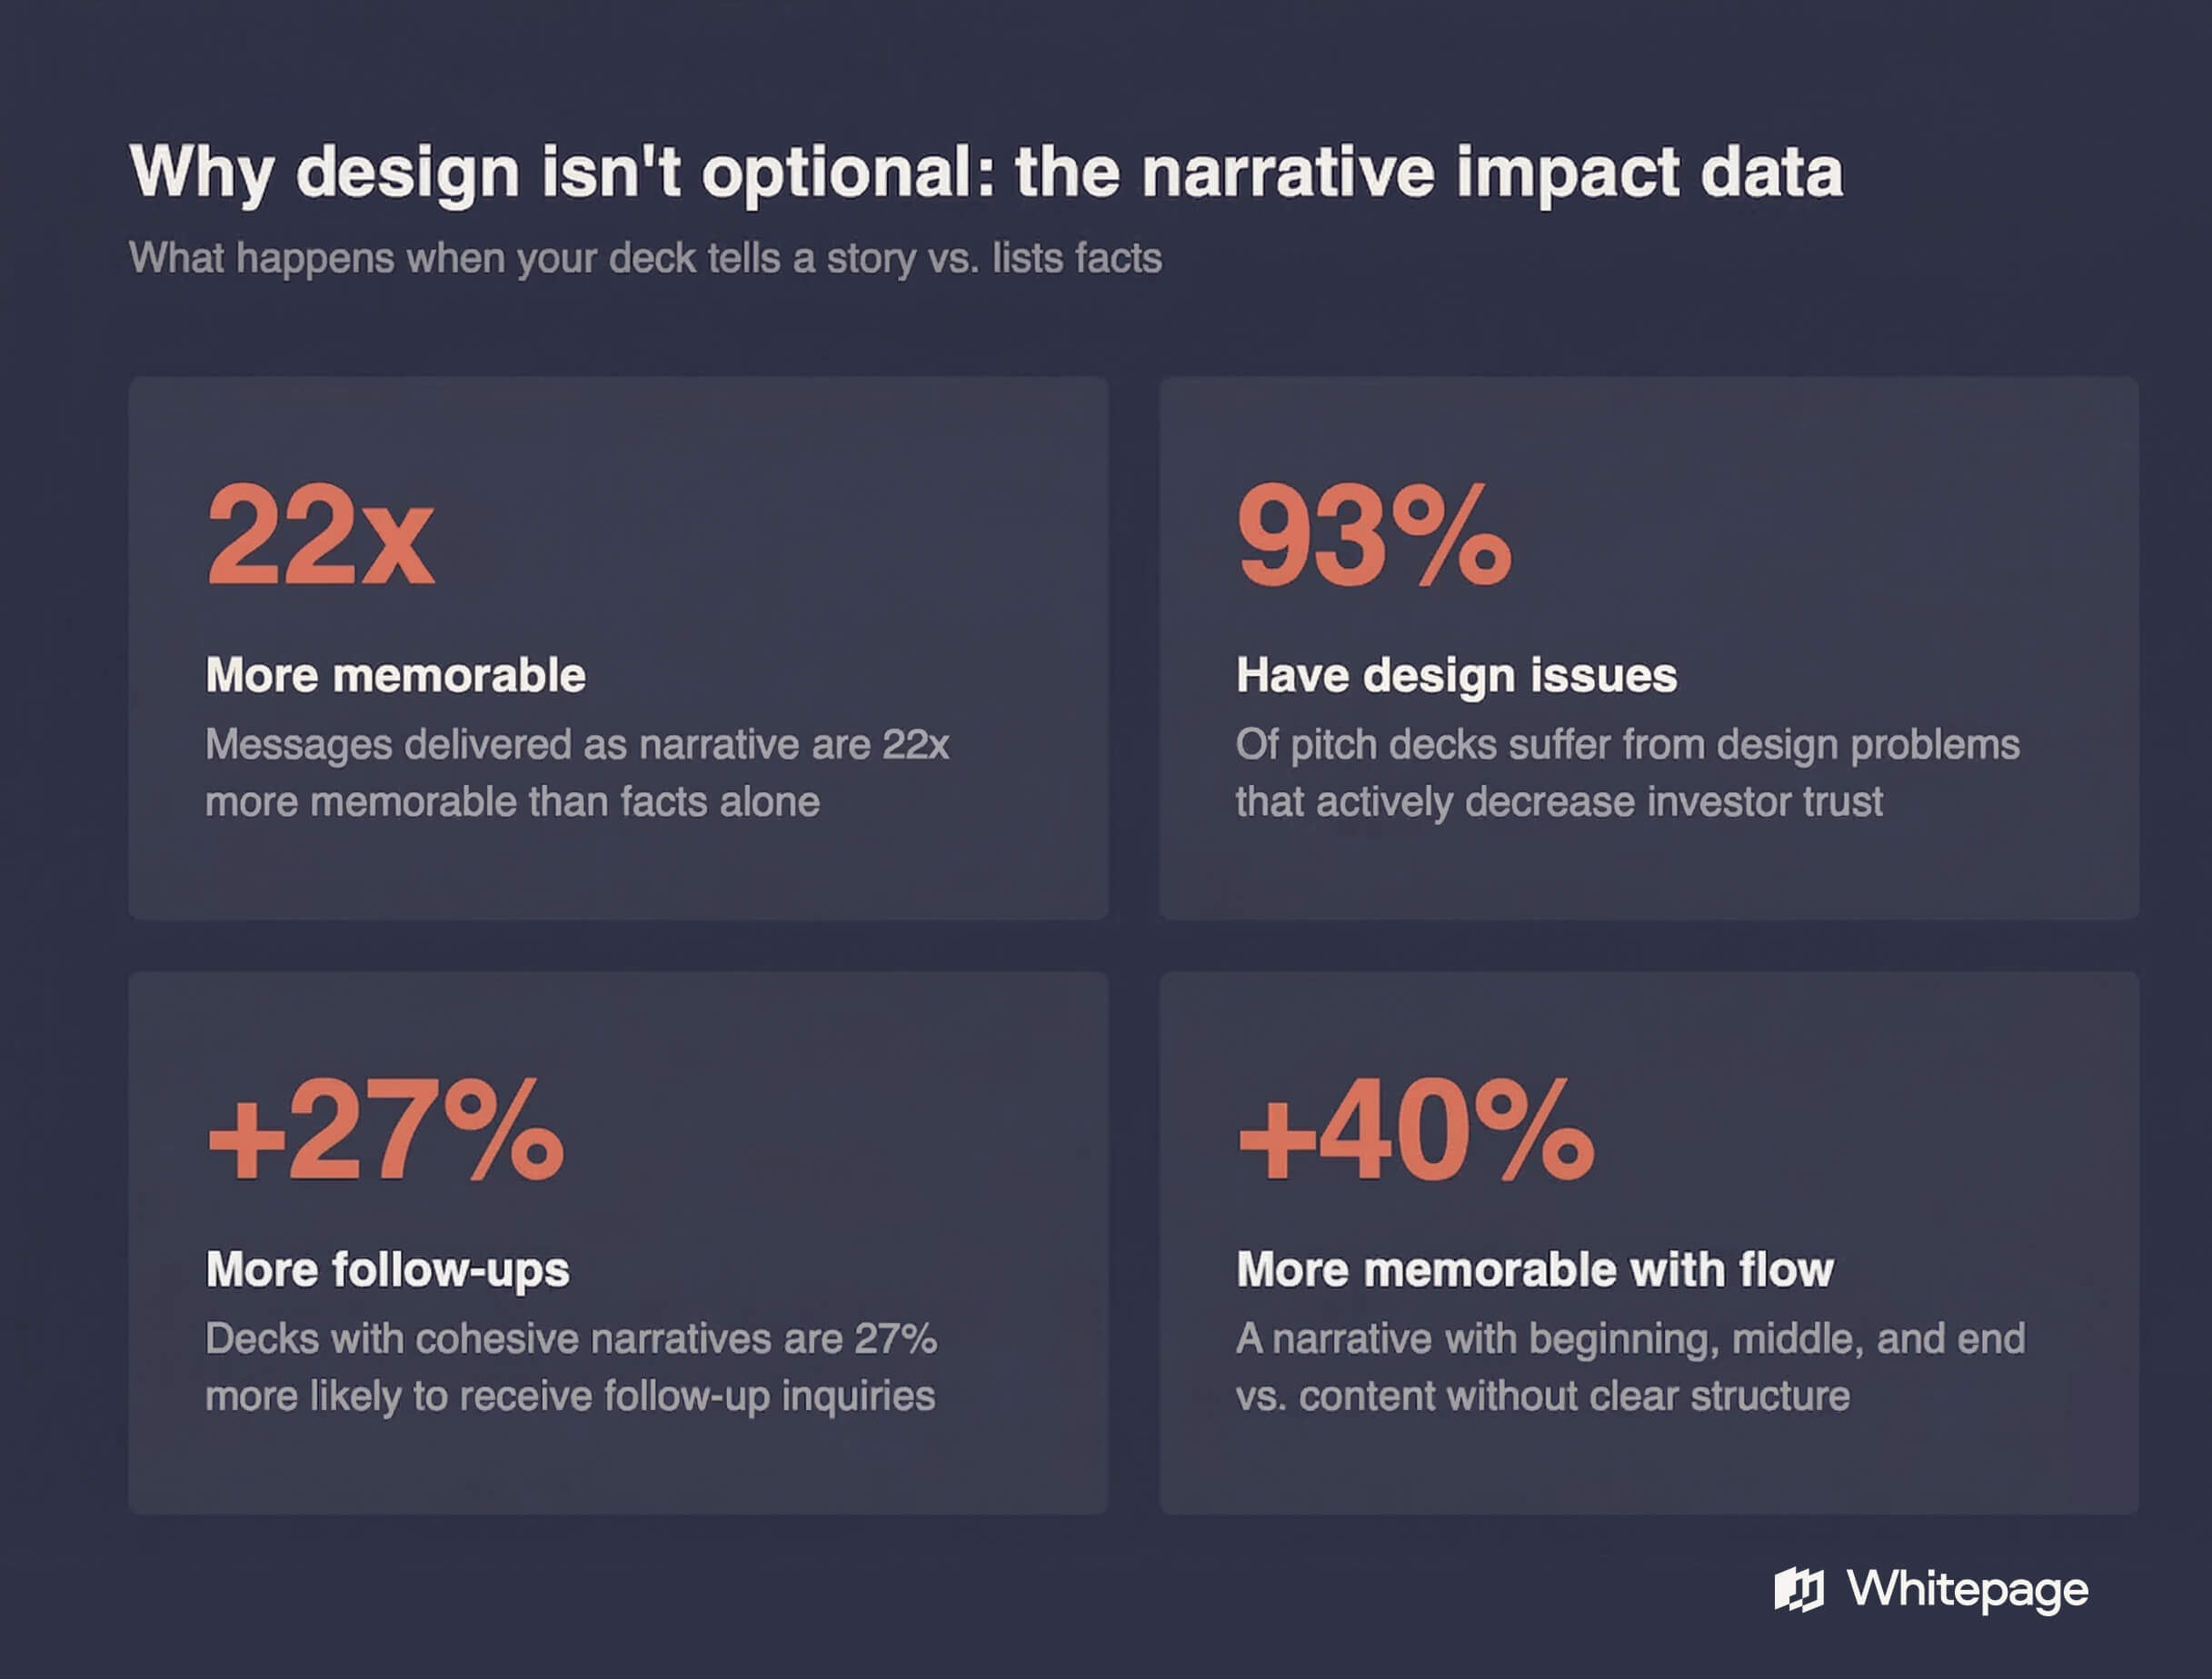
At Whitepage, we flip this. Every project starts with the audience's problem and earns the right to talk about the solution. Our content strategists – each with direct fundraising experience — review every deck before a designer touches it. This isn't just a design preference. The data says narratives are 22x more memorable. When 93% of decks have trust-damaging design issues, getting both the story and the visuals right is the minimum viable standard.
AI-generated decks are increasingly common in our intake – and they all share the same problem. The structure looks right. Correct slide order. Standard sections. Reasonable copy.. But the opportunity slide says $50 billion TAM. The financials show $10 million in year three. The deck never builds the bridge between those numbers. The competitive moat reads like it was pulled from a blog post. The problem statement could describe any company in the sector.
That's the 70/30 split. AI handles the first 70%: structure, formatting, generic content reliably well. The remaining 30% is where decks actually differentiate: narrative coherence, number alignment, visual logic that translates a complex idea to a skeptical reader in 21 seconds. And in a market where 1,500+ decks land on each VC's desk annually and fewer than 5 get remembered – that 30% is the whole game. Not most of it. All of it.
Guy Kawasaki's 10/20/30 rule recommends 10 slides — but actual funded decks average nearly double that.
Every founder knows their deck is too long. I have never once had someone show me 40 slides and say "I think this is the right amount." They know. They just don't know what to cut.
One enterprise SaaS client sent us a 60-slide deck for 30-minute calls. A restaurant tech founder: 89 slides. A medical device VP showed us his deck and pointed at a random stock image: "Why is there a rocket ship for a pilot? I don't know." He'd inherited the deck from his manager. Nobody had questioned it.
The research is clear: completion rates tank past 15 slides. But cutting is genuinely harder than writing. Every slide feels essential to the person who made it. The problem needs context. The technology section needs a diagram. The financials need assumptions listed. Before you know it, there's no arc, just a sequence.
The honest question: if you can't explain what each slide contributes to the investment decision, why is it there? Appendix slides exist for the deep-dive material. The main deck's job is to make someone want a second meeting – not to replace one.
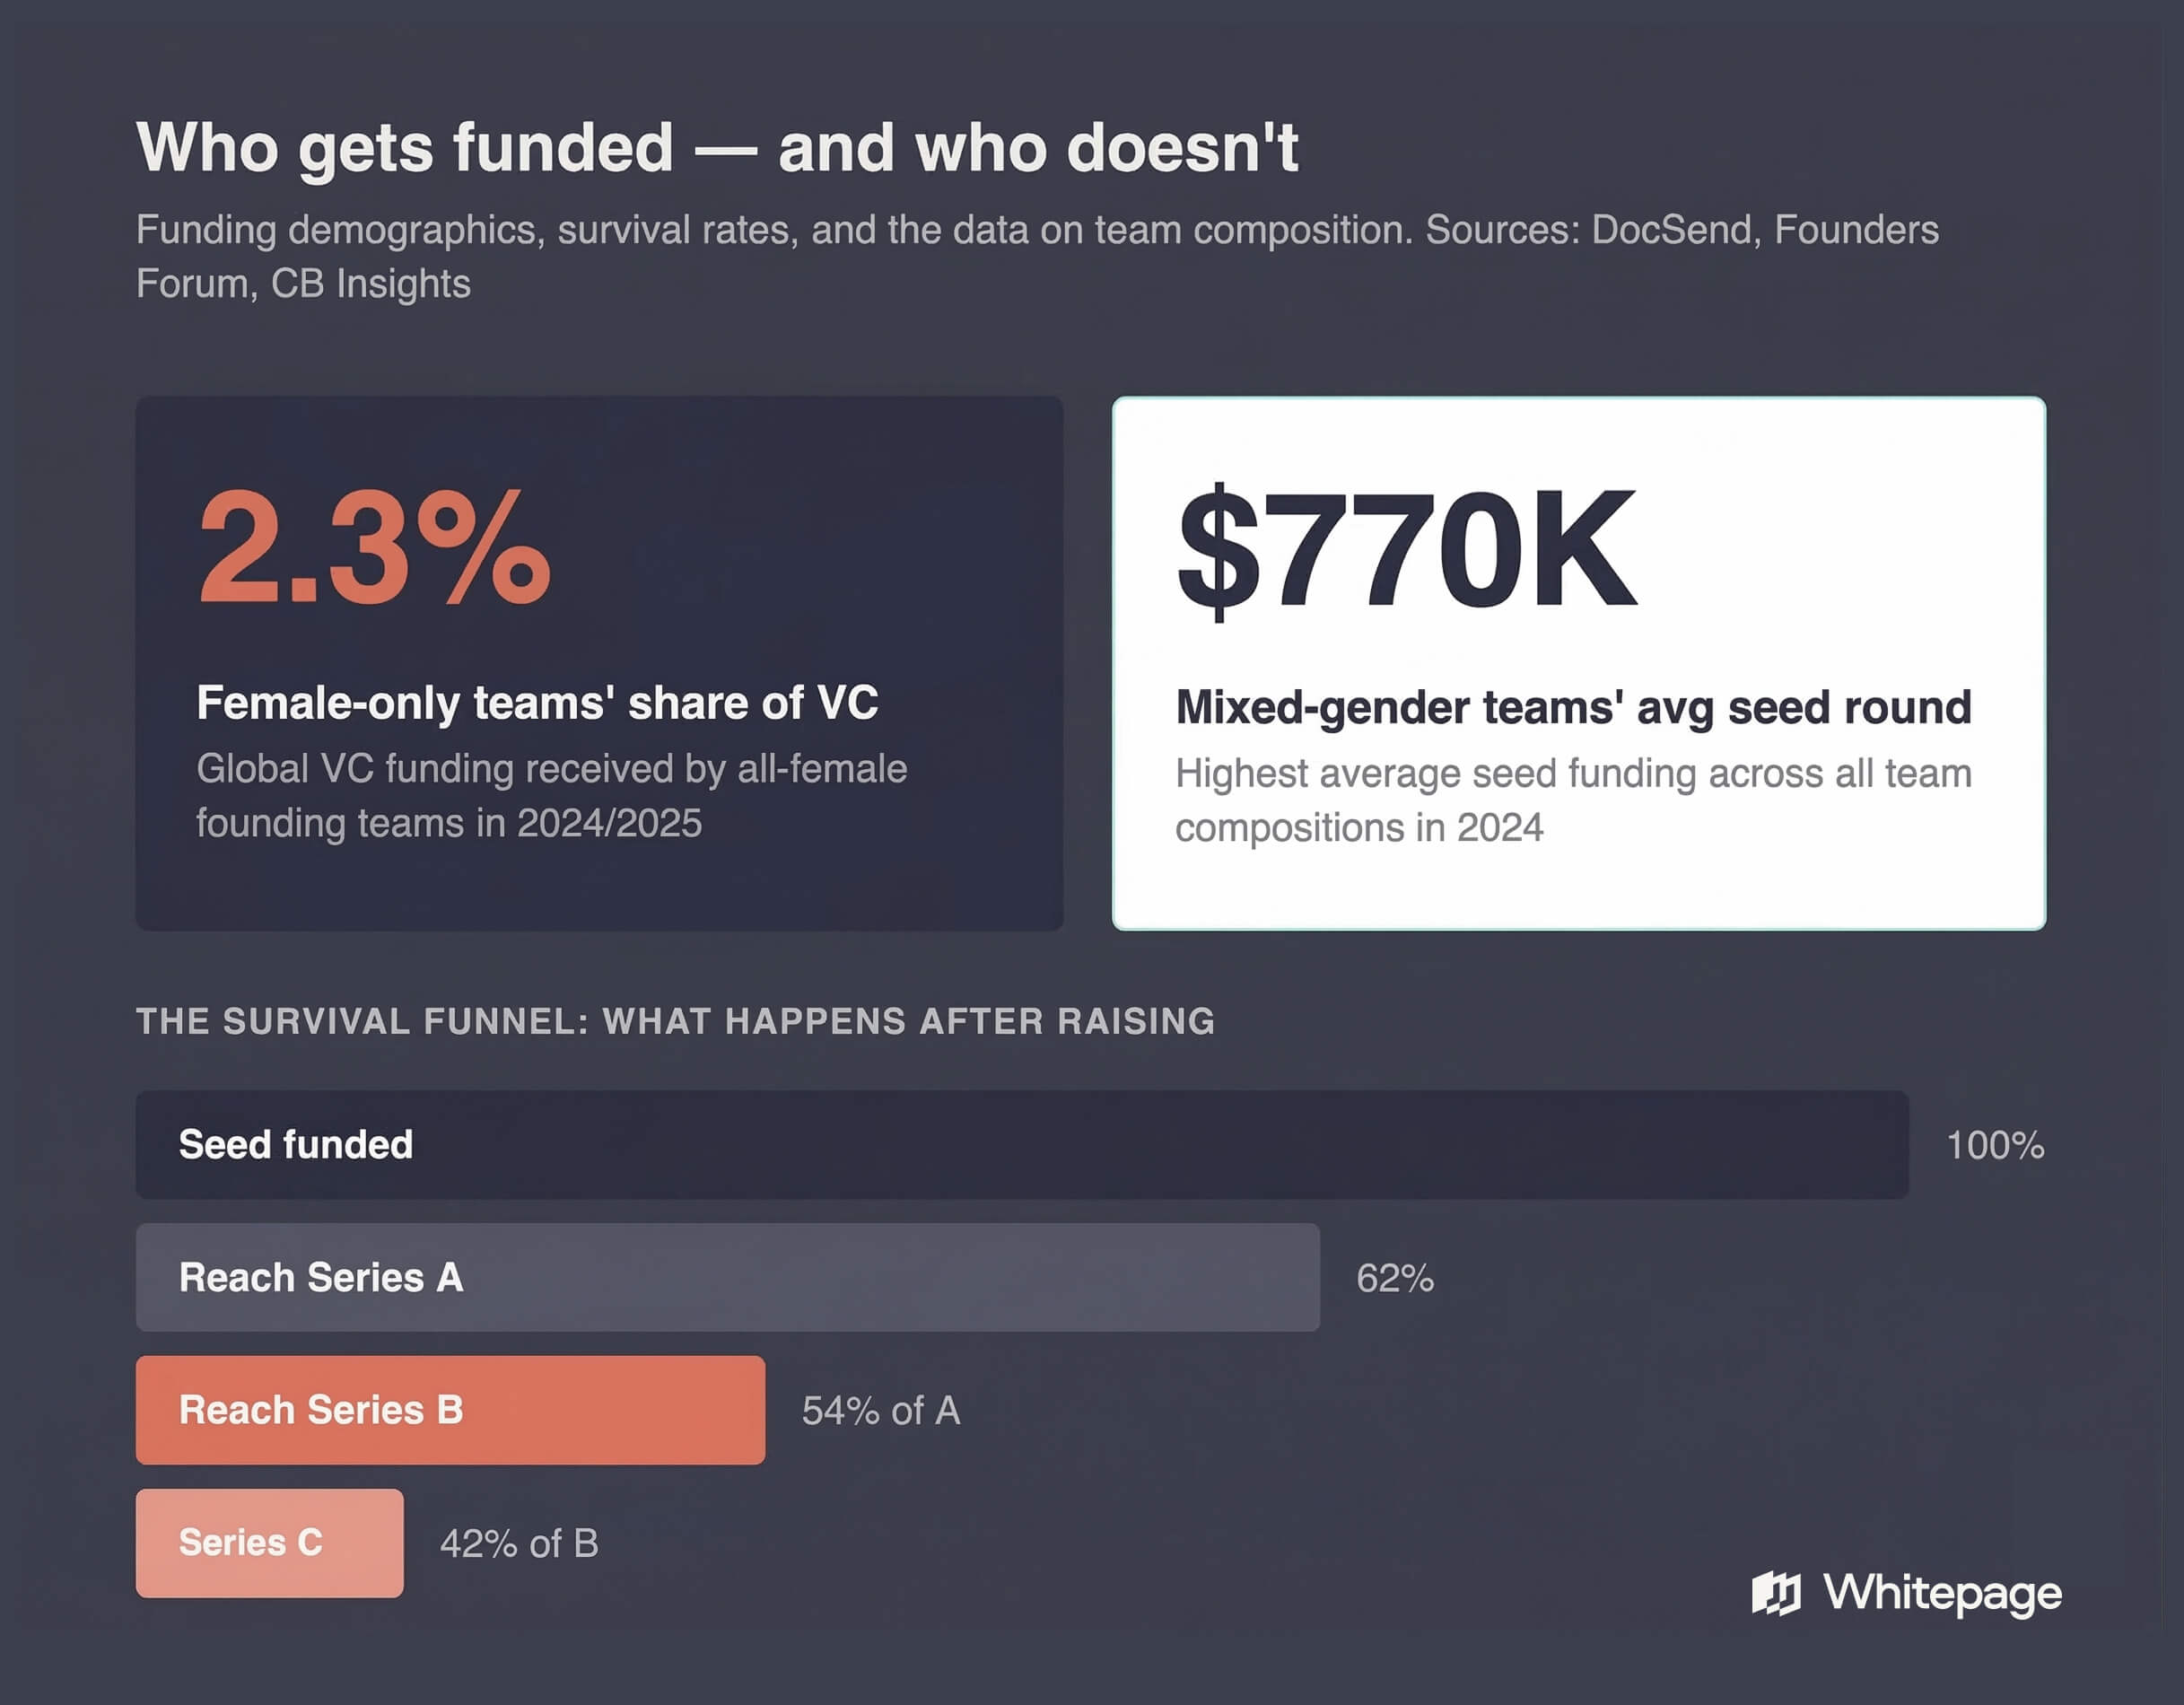
The mixed-gender data offers one bright spot: those teams pulled the highest average seed funding at $770K, outperforming all-male counterparts. And investors spent 20% more time on Team slides for underrepresented founders. Whether that's heightened scrutiny or genuine engagement, the conclusion is the same – the team slide becomes more consequential, not less.
Here's what's worth remembering: the deck is arguably the single most controllable variable in the fundraising process. You can't rewire the VC ecosystem before your next raise. But you can make sure your 12 slides are sharper, more specific, and harder to forget than the other 1,499 in that investor's annual pile.
Nobody plans to hire a pitch deck agency. It happens after the DIY version doesn't land.
The sequence is remarkably consistent: build it yourself in PowerPoint. Try a ChatGPT outline. Maybe a Canva template. Maybe a freelancer who designs beautiful slides but doesn't understand fundraising. Two or three iterations later — and usually a few weeks behind schedule – the founder realizes something still isn't clicking.
One blockchain founder described the moment: "We have multiple different iterations where we thought maybe we could design it ourselves. And now we're saying — okay, let's pause here." His co-founder added, simply: "I feel a sense of relief."
That relief isn't about offloading work. It's about finally having someone who gets what the investor needs to see — and what the founder needs to stop showing. The gap between "complex idea in the founder's head" and "12 slides that make a stranger care in under three minutes" is a translation problem. Designers make it pretty. AI gives it structure. But figuring out which 12 of your 40 slides actually matter — that's a different skill entirely, and it's what's driving a market growing at 10.8% a year.
We don't just design slides. We run every pitch deck project through a two-phase process — content first, design second. A dedicated content strategist with direct fundraising experience builds the narrative wireframe. Only after the founder approves the story do we move to concept design. Our team has worked with companies from pre-seed to IPO roadshows — from bootstrapped solo founders to DoorDash, Airbnb, and $3 billion manufacturers. The pattern doesn't change with company size: enterprise teams arrive with the same core problem as pre-seed founders — too much about them, not enough about their audience.
If these statistics sound familiar — if your deck is 30+ slides and you know something isn't landing but can't pinpoint what — we'd be happy to talk it through.


The average is 2 minutes 24 seconds according to DocSend's 2024 data, down 24% since 2021. Seed-stage decks get even less — under two minutes. At Whitepage, we design every deck to earn its time within that window — starting with narrative structure before any visual design.
The consensus from DocSend, Peony, and VC advisors is 10–15 slides for early-stage and up to 20 for Series A and beyond. Decks over 15 slides see sharp completion drop-offs. Effective decks use 300–600 total words. Our average delivery at Whitepage is 12–15 slides — distilled from incoming decks that typically arrive at 30–40.
The DocSend/HBS study found 58 investors contacted, 40 meetings, 12.5 weeks. Pre-seed founders may contact up to 71. The pitch-to-check conversion sits at 5–6% — which means your deck needs to work consistently across dozens of viewings.
Three shifts stand out: investor attention continues declining (now under 2 minutes for seed), Team slides are gaining importance as VCs prioritize people in an AI landscape, and mobile-first viewing now accounts for 70%+ of initial reviews. At Whitepage, these three trends have directly changed how we structure, write, and design every deck we deliver.


867 BOYLSTON ST
BOSTON, MA 02116


